|
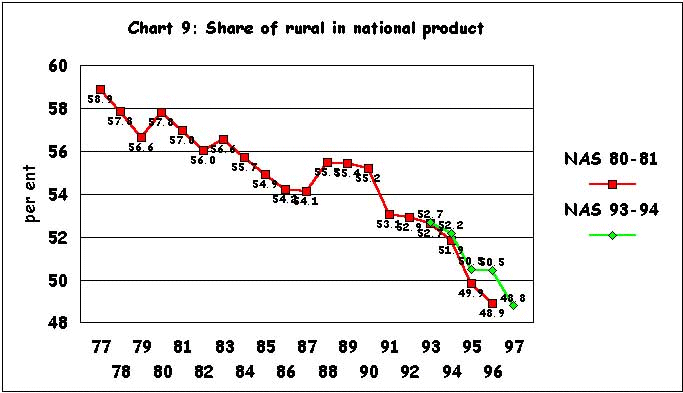
There are two interesting results which emerge from
this exercise. First, as Chart 8 shows, the share of
rural in total incomes has fallen quite sharply. This
is also true for the years for which the figures with
1993-94 as base have been computed. This fall in rural
incomes is, however, not just because the share of agricultural
incomes in national income have fallen. The second interesting
trend is that, the share of non-agricultural incomes
in total rural incomes which rose sharply between 1977-78
and 1990-91 has stagnated since then (Chart 9). One
reason why rural poverty declined during the 1970s and
1980s was that income earning opportunities in the rural
non-agricultural sector, expanded substantially, driven
mainly by a large expansion of government expenditure
in the rural areas. The reduction in such expenditure
during the years of reform has affected that expansion
adversely. (Macroscan,
February 2000).

Chart
9 >> Click
to Enlarge

Chart
10 >> Click
to Enlarge
In
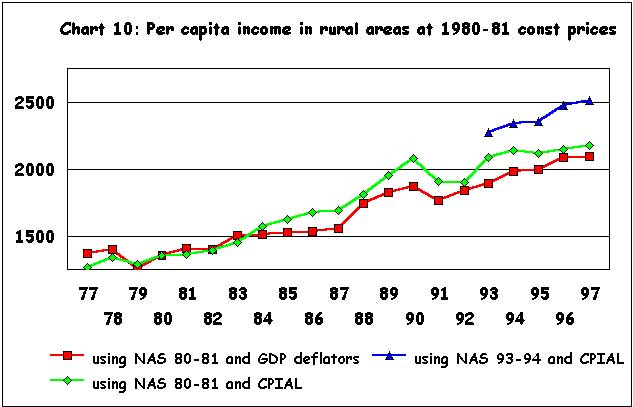
the event, as Chart 10 shows, the exercise suggests
a very sharp slowdown in the growth of per capita rural
real output and incomes during the nineties. Such incomes
can be measured in two ways: either using the implicit
NAS deflators for the composition of rural produced
goods and services or by deflating nominal income with
the CPIAL as in the poverty calculations. The first
method based on the NAS 1980-81 shows a decline in growth
rate from 3.1 per cent per annum during the triennium
ending (TE) 1980-81 to TE 1990-91 to 1.8 per cent per
annum during TE 1990-91 to TE 1997-98. The second method,
also based NAS 1980-81 shows an even larger decline,
from 3.9 to 1.4 per cent per annum, and indeed shows
negligible growth after 1990-91. The pattern is almost
identical to that observed for rural real consumption
from NSS, as plotted in Chart 2, and thus serves to
remove much of the poverty puzzle.
Shifting to NAS with base 1993-94 shows higher incomes
and higher growth, but, if this is spliced backward
to the old series, the result is still a decline in
per capita rural income (CPIAL deflated) from 3.9 to
1.5 per cent. An interesting aspect of the revision
of CSO National accounts is that the NAS with 1993-94
as base, places the GDP at factor cost in agriculture
at Rs. 223148 crore as opposed to Rs. 206322 crore in
the old series with 1980-81 as base. In its elaboration
of the factors underlying this Rs. 16826 crore increase,
the CSO attributes Rs. 13905 crore to an increase in
the value of output of fruits, vegetables and floriculture,
as a result of a shift in the data source from Directorate
of Economics and Statistics, Ministry of Agriculture
to the National Horticulture Board. This has obviously
meant that the weight of fruits and vegetables in total
GDP has changed quite substantially, and this also contributes
significantly to the higher estimate of private consumption
in the new series.
The reliance on the National Horticultural Board's figures
has also meant that the rate of growth of fruits and
vegetables output is now much higher than the figure
yielded by other estimates. Thus, while official index
of fruits and vegetables production has risen by about
18 per cent between 1993-94 and 1998-99 and the value
of fruits and vegetables output rose by about 14 per
cent between 1993-94 and 1996-97 as per the NAS with
1980-81 as base, the 1993-94 series shows a 33 per cent
increase for the period 1993-94 and 1997-98. As a result
fruits and vegetables are now estimated to account for
more than 50 per cent of the increase in total value
of crop output during this period. It is this factor
which contributes to the substantially higher rise in
agricultural GDP in the 1993-94 series when compared
with the 1980-81 series, which was noted earlier.
It may well be that there has indeed been such massive
diversification and increase in the value of fruits
and vegetables during the nineties. After all, it is
possible that higher urban incomes (which our estimates
put, residually, as increasing at over 4.5 per cent
in real per capita terms during the 1990s as against
only around 2 per cent during the eighties) have boosted
demand. But the sheer magnitude of the revision requires
re-examination since, if this has indeed happened, fully
23 per cent of crop output is accounted by fruits and
vegetables grown in only 4.5 per cent of crop area.
If this is not actually the case, then whatever little
still remains unexplained in terms of the "puzzle"
of higher poverty amidst growth, is likely to lie in
the revisions of the national income estimates which
have recently been carried out in the NAS.
Thus, a careful look at the available data currently
suggests the following : the rate of growth of per capita
output in real terms in the rural sector has sharply
decelerated from 3.1 per cent in the 1980s to 1.8 per
cent in the 1990s .This is a result of the combination
of a collapse in rural non-agricultural employment and
a significant deceleration in agricultural growth other
than in the category "fruits and vegetables".
The purchasing power of the incomes derived from sales
of this output in turn depends upon the relative price
indices, and if the price index relevant for the rural
poor (CPIAL) is used, then there is no increase in real
incomes in the rural sector. Thus, the trends in rural
poverty are no longer a puzzle, but reflect the effects
in the countryside of macro-economic policies at work
.
|

