|
That
the poverty puzzle is about real and not nominal consumption
leads immediately to the conclusion that what is of
central importance are the price deflators used to move
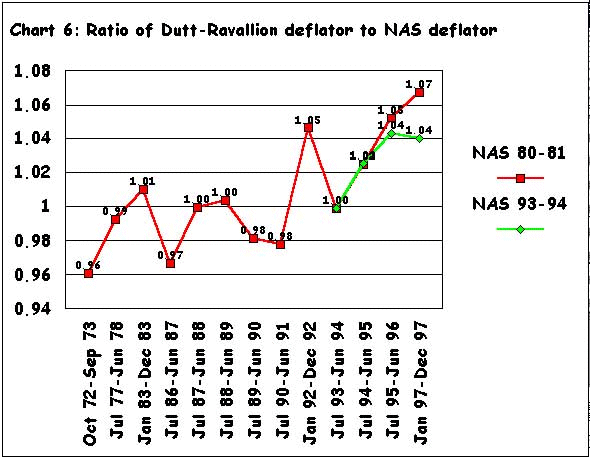
from nominal to real consumption. As Chart 6 shows,
the deflator used by the World Bank researchers has
indeed increased much more sharply upwards during the
1990s than those implicit in the NAS estimates. The
implicit deflators from the NAS relate to the consumption
basket of the nation as a whole, while the deflators
for poverty calculations are expected to reflect more
closely the consumption basket of the poor. In practice,
the deflators used to convert NSS rural and urban nominal
expenditures into real trends are based on the official
consumer price indices for agricultural labourers (CPIAL)
and industrial workers (CPI-IW).

Chart
6 >> Click
to Enlarge
Both these consumer price indices have increased faster
than the implicit NAS consumption deflators during the
1990s, and, given the weight of the rural sector, the
CPIAL dominates in the implicit deflator for NSS consumer
expenditure in the World Bank's real consumption series.
Unlike this latter implicit deflator, which is available
only by NSS rounds, both the CPIAL and the implicit
NAS deflators are available over the entire period 1972-97,
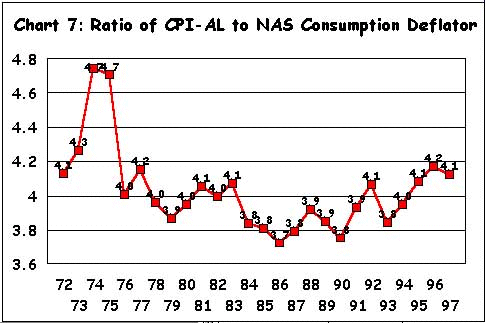
and their ratio is plotted in Chart 7. It is evident
that the CPIAL increased much less than the NAS deflator
in the 70s and 80s but has increased much more in the
1990's.

Chart
7 >> Click
to Enlarge
It must be noted that food items have a large weight
in the indices of consumer prices for industrial workers
and agricultural labourers, especially the latter. The
faster rise in these indices are therefore likely to
be the result of the observed tendency in recent years
of a faster increase in the prices of various food items,
particularly cereals, than of other items consumed by
the rich.
Thus what emerges is that one of the reasons for the
stagnation in real per capita consumption and therefore
of the incidence of rural poverty during the 1990s is
the adverse consequence that rising food prices have
had for the poorer sections of India's
population. Clearly, the rise in the relative food price
during the 1990s has hurt the poor hard, even at a time
of relatively high income growth which itself, as noted
earlier, was accompanied by some increase in the inequalities
in nominal consumption expenditures.
Trends
in Rural Incomes
A
noteworthy feature of the trend in the incidence of
poverty during the 1990s is the fact that the absence
of any reduction in poverty has been more true of rural
than urban areas. Does this have anything to do with
the changes in the structure and volume of rural incomes?
Unfortunately, the CSO does not give a break up of sectoral
and total incomes by rural and urban areas respectively,
excepting for the two base years 1980-91 and 1993-94.
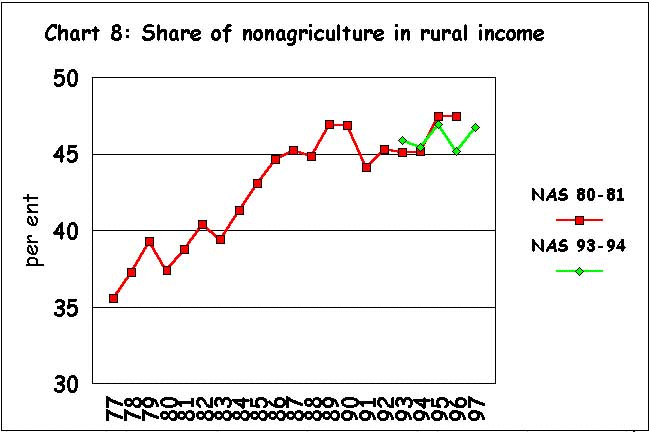
However, the NSS gives figures on employment by sectors
for all years. Using this we have computed two series
on sectoral incomes with 1980-81 as base for the years
1977-78 to 1996-97 and with 1993-94 as base for the
period 1993-94 to 1997-98.
The method adopted for this is as follows. Since we
have both sectoral employment and income figures for
rural and urban areas for 1980-81 and 1993-94, it is
possible to compute sectoral productivities for the
primary, secondary and tertiary sectors in the rural
areas and urban areas for that year. This allows us
to compute the ratio of urban to rural productivities
for each sector for that year.
We assume that this ratio remains constant in all subsequent
or previous years, i.e. that in the case of each series
the rates of growth of productivities are the same so
that the ratio of productivities do not change. Based
on this assumption, and using the overall GDP figures
and the figures on rural and urban sectoral employment
from the NSS, the level of rural and urban sectoral
incomes is estimated for the remaining years. It should
be obvious that assuming that rural productivities in
different sectors grow at the same rate as urban productivities
would if anything exaggerate the growth of rural income.

Chart
8 >> Click
to Enlarge
|

