|
This
is significant because it is known that the NSS tends
to underestimate overall consumption in the country,
resulting in a substantial divergence between the estimates
of total and per capita consumption as yielded by the
NSS surveys and in the NAS. If income inequality has
not worsened during the 1990s and if the divergence
between the consumption estimates provided by the NSS
and NAS has increased, then the poverty figures themselves
would be suspect.
Till recently, it was the practice in the Planning Commission
to calculate poverty figures after blowing up the NSS
consumption estimates to deal with such underestimation.
A return to such a procedure would not only reduce measured
poverty significantly, it could also negate the observed
stagnation or rise in the incidence of poverty during
the 1990s. The lack of correspondence between growth
and poverty trends could then be seen as a result of
statistical inadequacies rather than a reflection of
real trends.
However, most academic research, as indeed the work
at the World Bank, has not in the past favoured blowing
up the NSS consumption estimates since there is evidence
that most of the underestimation that occurs is in the
consumption of the rich, so that the unadjusted NSS
figures would still be measuring poverty correctly.
Indeed, this was the view of the Expert Group in 1993
as a result of whose recommendation the old Planning
Commission method was discontinued.
An implication of this, which is still not adequately
appreciated, is that inequality measures obtained from
the NSS underestimate the true inequality which is likely
to be higher the greater the discrepancy between the
NSS and NAS mean consumption estimates. If increasing
discrepancy between the two data sets occurs in such
a way that NAS shows growth in mean consumption but
the NSS shows higher poverty without increased inequality,
then either one must reject the Expert Group recommendations
outright or conclude that true inequality has risen
by so much as to wipe out the possible benefits of growth.
Such a situation would, however, be an impasse since
in the absence of a measure of "true" inequality,
commentators could continue to debate the relative virtues
of the erstwhile Planning Commission method versus that
of the Expert Group without necessarily reaching consensus.

Chart
3 >> Click
to Enlarge
Luckily, however, the evidence, does permit stronger
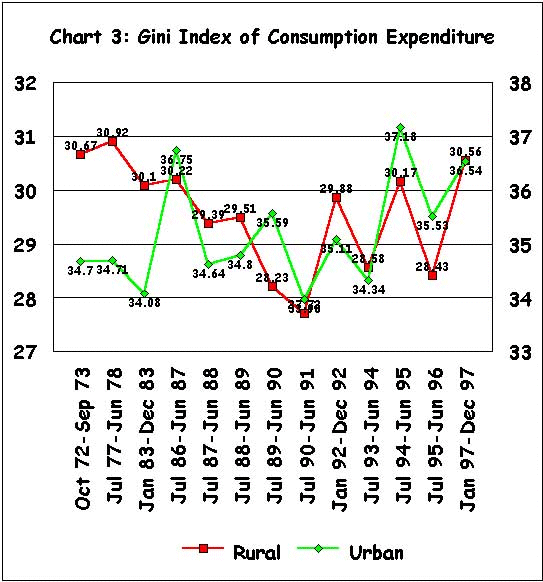
conclusions. First, as Chart 3 shows, the Gini coefficients,
or the indices of inequality in the distribution of
NSS consumption expenditure, as calculated at the World
Bank display interesting trends. Rural inequality fell
steadily between 1972-73 and 1990-91, but has since
then fluctuated wildly around a rising trend. That is,
there is no contradiction between the direction of movements
in inequality and that in poverty as far as NSS data
for rural India is concerned. In urban India, on the
other hand, the 1990s seem to be associated with falling
poverty even as inequality increased, presumably because
income growth was sufficiently high.
Second, and more importantly, a comparison of the absolute
per capita consumption figures at current prices obtained
directly from the NSS and from the NAS by interpolating
from financial years to NSS rounds (Table 1), shows
no strong evidence of a widening gap between the two
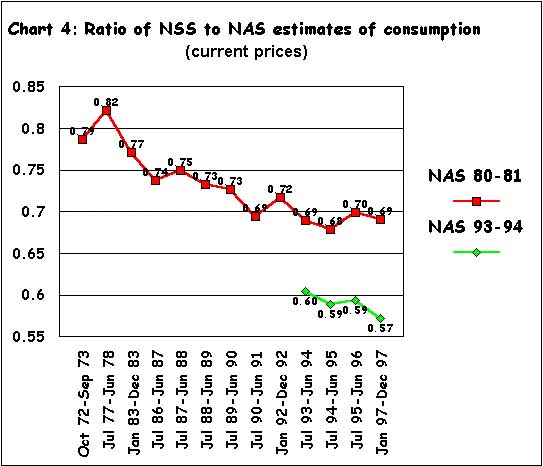
during the 1990s. The ratio of NSS consumption expenditure
figures and NAS consumption expenditure figures as yielded
by the series with 1980-81 as base, did fall from 0.79
to 0.69 between 1972-83 and 1990-91, but has remained
at that level subsequently (Chart 4).

Table
1 >> Click
to Enlarge

Chart
4 >> Click
to Enlarge
It is true that the same ratio calculated with NAS consumption
expenditure figures from the new series with 1993-94
as base does show a decline from 0.60 in 1993-94 to
0.57 in 1997-98, but this is too small to explain the
poverty puzzle. Per capita consumption in nominal terms
increased by 98 per cent between 1990-91 and 1997 according
to the NSS. The corresponding growth in NAS is 99 per
cent when the old 1980-81 series is extended from 1996-97
to 1997-98 using the new 1993-94 series and 111 per
cent when the new series is carried back to 1990-91
using the old one. The NAS consumption growth would
be 140 per cent if the 1997 figure from the series with
1993-94 as base is compared to the 1990-91 figure from
the series with 1980-81 as base, but this is surely
invalid !
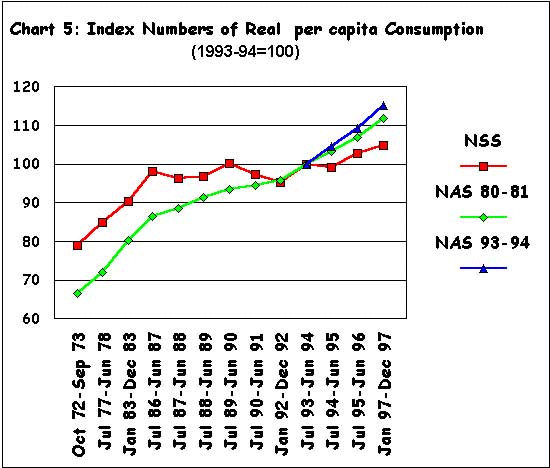
The poverty puzzle is, therefore, not mainly in differences
between the NSS and NAS regarding nominal consumption
trends but in the trend in real consumption. As Chart
5 shows, the indices of real per capita mean consumption
obtained directly from the two national accounts series
have increased much more sharply than the index obtained
by appropriately averaging the urban and rural real
per capita mean consumption figures computed by the
World Bank researchers from the NSS figures. The latter
shows a growth of only 4 per cent between 1990-91 and
1997 against growth of 20 and 23 per cent according
to the old and new NAS series, appropriately spliced
forwards and backwards.

Chart
5 >> Click
to Enlarge
|

