|
Charts 1 and 2 give the work force participation rates (that is,
number of all workers as a ratio of total population)
for men and women in rural India
for a fairly long period, from the early 1970s to the
late 1990s. It is evident that the male work force participation
rates have remained broadly stable over this entire
period, fluctuating within a relatively narrow band
between 54 per cent and 56 per cent. Within this, the
latest period, the first half of 1998, shows a relatively
sharp decline. It should be mentioned here that while
this decline has been particularly sharp in the younger
age-bracket (5-14 years) which is a positive development,
it has also declined in other age-groups (including
the most active group of 15-59 years) as well. This
decline in usual status work participation is also matched
by a similar decline in terms of the weekly status definition
in 1998.
For rural females, the picture of work participation has shown a
much higher degree of fluctuation. Here it is important
to remember that while there continues to be a significant
degree of underestimation of the actual (largely unpaid)
labour of women, to the extent that the current estimates
reflect the access of women to recognised productive
employment, it is an important indicator of material
status.
As Chart 2 shows, the overall picture of female work
force participation in the rural areas is one of fluctuations
around a declining trend. This is surprising because
the sensitivity of NSS investigators to the possibility
of women working has if anything increased by the 1990s,
so that the likelihood of under-reporting according
to the prevailing definition is less. Female work force
participation rates were on average significantly higher
in the 1970s until the mid-1980s. While the 1993-94
data do show a level comparable to the 1987-88. the
general pattern based on the annual surveys shows a
fairly sharp decline. The latest year in fact shows
the lowest rate over the entire period. This tendency
is extremely significant and the causes for this need
to be investigated in much more detail.

Chart 3 >>
Click
to Enlarge

Chart 4 >>
Click
to Enlarge
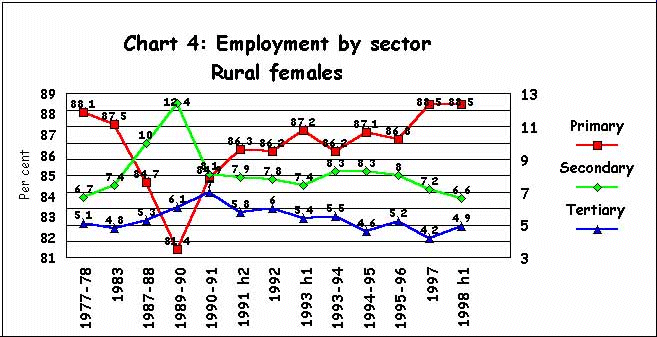
Charts 3 and 4 describe the pattern of employment for
all rural workers for males and females respectively.
The picture that emerges from both of these charts,
but most strongly for male rural workers, is that the
period from 1997-78 to 1987-88 witnessed a significant
decline in the proportion of primary sector employment,
and the period thereafter, and especially over the 1990s,
has indicated first a reversal of that pattern, followed
by a slight increase in the share of primary sector
employment over the 1990s.
For rural male workers, the share of primary sector
employment fell from more than 80 per cent in 1977-78
to 70 per cent by 1990-91 - a fall of nearly ten percentage
points which is a very large shift over a little more
than a decade. The shift was to both secondary and tertiary
sector activities. However, thereafter there was an
increase in the share of primary sector employment,
and over the 1990s the ratio has remained around 75
per cent, increasing slightly over the period.
For rural female workers, the picture is similar. Primary
sector employment declined from 87 per cent in 1977-78
to around 81 per cent in 1989-90 - a decline of around
six percentage points. Subsequently it has started increasing
again, and stood at nearly 89 per cent by 1998. For
both men and women, the shift to primary work has been
mainly at the expense of the secondary sector, although
even tertiary sector employment is lower compared to
the levels achieved at the close of the decade of the
1980s.
These trends are extremely important, because it is
now widely accepted that the diversification of rural
employment away from the primary sector to non-agricultural
activities in the period 1997-78 to 1987-88 was a significant
factor in the reduction of the incidence of poverty
at an all-India level.
There is now significant evidence that that the main
dynamic source of rural employment generation over the
period from the mid 1970s to the late 1980s was the
external agency of the state rather than forces internal
to the rural economy. Indeed, the role of dynamic agriculture
was significant only in states such as Punjab and Haryana where agricultural incomes had crossed
a minimum threshold and where further increases in agricultural
output were accompanied by labour displacement rather
than greater labour absorption. Outside this limited
region, the pull was provided mainly by external stimuli.
In certain very specific regions, for example along the Bombay-New
Delhi and the Bombay-Bangalore highways, industrial
development and the growth of services linked to this
did make inroads into rural society by creating new
employment opportunities not only in the tertiary sector
but also in small-scale industry. In addition, in the
hinterland of industrially or commercially developed
regions, there was growing incidence of workers who
lived in rural areas but commuted to urban areas - a
tendency which was enhanced by the fact that the organised
sector has tended to prefer casual workers to regular
employees, and because rising urban rents and deteriorating
urban infrastructure along with falling transport costs
have influenced workers' choice of residence.
|

