The
point to note is that this increase was not of a magnitude
adequate to undermine the gains in terms of import
containment registered in other areas. From Chart
4, which presents the shares of different categories
of imports in the total, it is clear that while the
share of oil imports has fluctuated significantly,
rising sharply in periods when the trade deficit has
widened, the share of export related imports has varied
within a small range and stagnated over time, and
that of non-oil bulk imports has declined. This has
meant that the rise in the share of other imports
did not result in a worsening of the trade deficit
to an unsustainable extent.
One reason why the other imports category did not
rise even further as a result of the liberalisation
was the fact that capital goods imports which rose
from $4.2 billion in 1991-92 to $10.3 billion in 1995-96,
stagnated thereafter, fluctuating between $9 and $10
billion till 1998-99 (Chart 5). This was the period
when after a short-term boom between 1993-94 and 1995-96,
Indian industry registered a deceleration in its rate
of expansion. That this deceleration would have affected
capital goods imports through its impact on investment
is partly corroborated by the fact that after 1998-99,
when industry began its slide into near-recessionary
conditions, capital goods imports fell below $9 billion
in 1999-00 touching $8.8 billion in 2000-01. Since
capital goods constitute an important component of
other imports, though its share fell from 60.4 per
cent in 1995-96 to 40.4 per cent in 2000-01 (Chart
6), this trend would have substantially influenced
movements in the 'other imports' category.

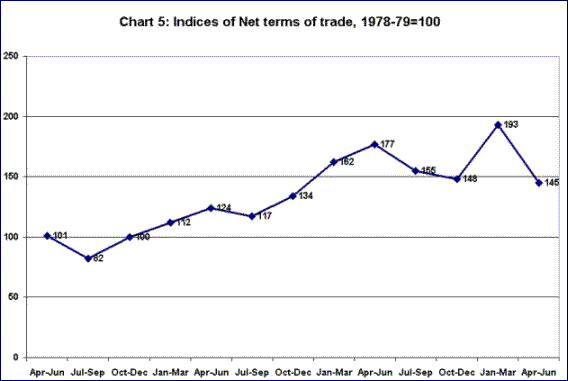
Chart
5 >> Click
to Enlarge

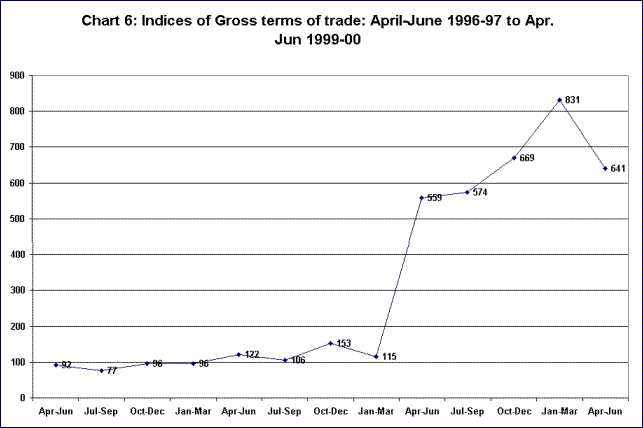
Chart
6 >> Click
to Enlarge
Has any fact other than demand played a role in influencing
the demand for imported capital goods? Chart 7, would
suggest that prices have played a role as well. Over
a 13-year period starting from 1980-81, the unit value
and quantum indices of imports of Machinery and Transport
Equipment maintained a consistent rise. However, in
1994-95, the unit value index, representing the price
of capital goods, dropped significantly, only to rise
sharply over the next four years till 1998-99, and
fall marginally thereafter. Interestingly the quantum
index of imports of Machinery and Transport Equipment
shot up in 1994-95 and then fell sharply till 1997-98,
before stabilising at that level over the next three
years.

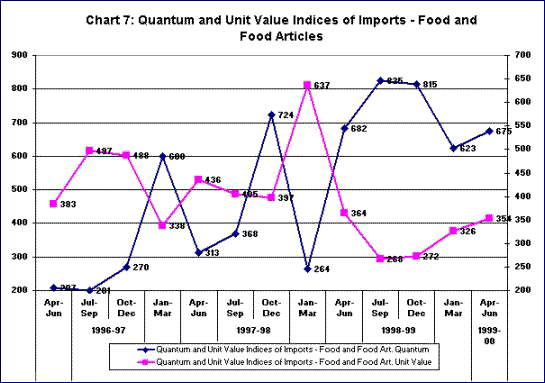
Chart
7 >> Click
to Enlarge
These movements seem to suggest that the demand for
capital goods imports is highly price elastic in nature.
However, some caution is called for in arriving at
that conclusion. To start with, Machinery and Transport
Equipment is an extremely heterogenous category, comprising
of an extremely wide range of entities. Further, the
structural changes in industrial production in the
wake of liberalisation have resulted in substantial
changes in the composition, quality and import-intensiveness
of industrial output and therefore in the nature of
its demand for imported capital goods and components.
Movements in import unit values may reflect changes
in the composition and quality of commodities being
imported rather than changes in prices of a given
set of commodities. This implies that changes in the
quantum of imports cannot be attributed directly to
prices.
Secondly, one consequence of liberalisation has been
an increase in the production of a range of "new"
import-intensive manufactures based on component imports
by production facilities that carry out assembly or
penultimate stage production activities. A crucial
requirement for these units is the adequate availability
of imported intermediates and components to meet demands
for the final product. Thus it is not merely an increase
in demand for the final product that triggers an increase
in imports, but expectations of any increase in demand,
since firms should be in a position to ensure delivery
in short periods of time and not be strapped by delays
created by import procurement.

