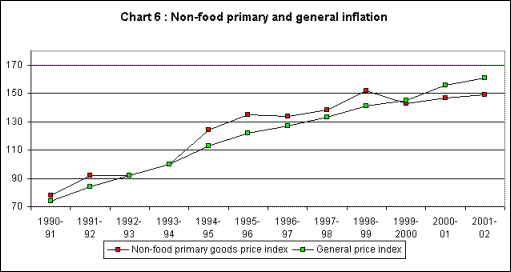
By
contrast, non-food primary commodities, which were
more directly affected by tendencies in international
trade, show much sharper deceleration. In fact, Chart
6 shows that prices of non-food primary commodities
actually fell after 1998, and have remained low thereafter.
Chart
6 >>
Click to Enlarge
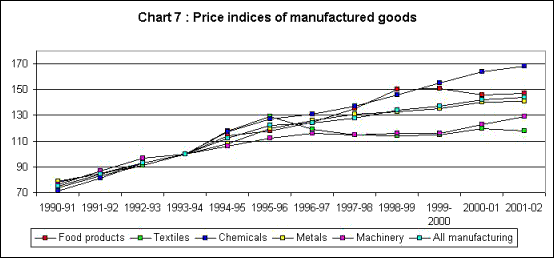
Most categories of manufactured goods also show substantial
slowdown in terms of rates of price change. This is
indicated in Chart 7, which suggests that sharp declines
in inflation rates occurred for textiles, food products,
machinery and other manufacturing categories. In fact,
for textiles and food products, prices have declined
in absolute terms by the end of the period, from their
earlier peaks.
Chart
7 >>
Click to Enlarge
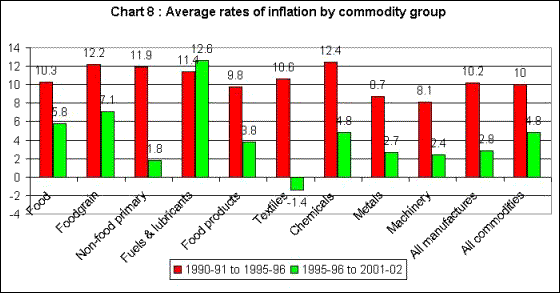
Chart 8 brings all this together in the form of average
rates of inflation over two different sub-periods,
1990-91 to 1995-96 and 1995-96 to 2001-02. The annual
rate of increase of the general WPI index, which was
10 per cent over the first sub-period, fell to less
than half that, at an average of 4.8 per cent over
the next sub-period. Food items – and particularly
foodgrain – did not slow down in price so substantially.
But textile products actually fell in price in the
second period, on average. And non-food primary products
also decelerated very sharply in terms of inflation.
This clearly reflected the effect of low world prices
for most such commodities. Next in terms of significance
in this regard was machinery, which was probably adversely
affected by the falling import prices of similar goods.
Chart
8 >>
Click to Enlarge
It is worth noting that fuels, light and lubricants
actually showed a higher average rate of inflation
in the second sub-period compared to the first. This
category constitutes an important element of costs
for all producers in the economy. Thus, a significant
part of costs did not decelerate, and even accelerated
in terms of price increase, for most producers, even
as prices of final products appeared to decelerate
or decline. This implies a squeeze on domestic producers,
which would be reflected in falling profit margins
or falling wage shares or both.
So in the aggregate, what has caused this very evident
decline in inflation? The current mainstream explanations,
which are heavily influenced by the monetarist approach,
tend to put a lot of emphasis on money supply and
the control of central bank lending to the government.
According to this position, tighter control over broad
money (M3) and limiting the ability of the government
to finance its deficits by borrowing cheaply from
the Reserve bank of India which would print money
in consequence, are the main causes of the overall
decline in inflation.
There are of course several problems with this argument
at a theoretical level. The monetarist argument is
based on the twin assumptions of full employment (or
exogenously given aggregate supply conditions) and
aggregate money supply determined exogenously by macro
policy. Neither of these assumptions is valid. In
fact there is a strong case for arguing that in a
world of financial innovation where quasi-moneys can
be created, the overall liquidity in the system cannot
be rigidly controlled by the monetary authorities.
Rather, the actual liquidity in the system is endogenously
determined.
Therefore the real monetary variable in the hands
of the government is the interest rate and thus attempts
to control money supply typically end up as forms
of interest rate policy instead. Further, the
notion of a stable "real demand for money"
function
(where the demand for money is determined by the level
of real economic activity) is one which gets demolished
by the possibility of speculative demand for money,
a feature which if anything is enhanced by financial
sophistication and the greater uncertainties of operating
in today's economies.
In any case, the empirical justification for such
an argument is also worse than negligible. In fact,
there is no clearly discernible relationship between
the rates of growth of money supply and of inflation
on the one hand, and real output growth on the other.
This is evident not only in India, but indeed in all
instances elsewhere in the world where monetarist
prescriptions have been pursued. The more complex
definitions of money that are being developed elsewhere
show this very starkly for other countries.
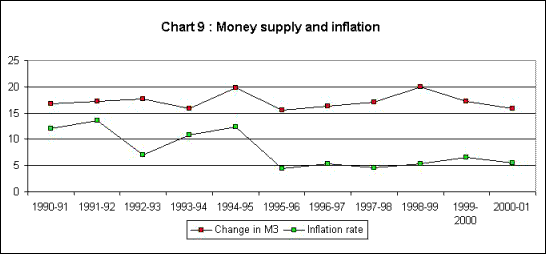
In the recent Indian case, a simple look at the relationship
between M3 and inflation rates would indicate immediately
that there is no relationship at all. This is shown
in Chart 9. While the stock of money (M3) continued
to grow at an average rate of around 17 per cent per
annum throughout this period, the aggregate inflation
rate, as we have already seen, declined quite sharply
to less than half of its earlier rate, progressively
over the decade.
Chart
9 >>
Click to Enlarge
