Themes > Features
06.08.2002
What happened to Inflation ?
One of the more striking
changes in the Indian economy in the recent past is the significant
decline in rates of inflation that has been experienced over the last few
years. As Chart 1 indicates, the annualised point-to-point rate of
inflation for the last day of each year, while fluctuating, fell quite
sharply from the middle of the past decade. Thus inflation according to
the Wholesale Price Index (WPI) is now less than 1.4 per cent per annum
according to the latest estimate from the end of May, bringing it very
close to a deflationary situation.

How did such a process occur? And what were the main elements of this decline in terms of different product categories? The government has been quick to claim the credit for this tendency, arguing that this speaks for the success of its economic strategy. But this is probably misleading. Indeed, the overall recessionary context within which this is occurring suggests that the real causes of declining inflation may simply be macroeconomic and international tendencies which reflect weakness in the Indian economy, rather than strength.
It should be noted that, since inflation in economies operating below full employment is the macro-economic effect of the struggle over distributive shares, in a sense changing rates of inflation reflect the changing balance of class forces in an economy. In the Indian economy, inflation has always been relatively low by international standards, and certainly well below the inflationary tendencies so commonly found in the Latin American countries, for example.
This is primarily because most of the workers and agriculturalists in the country have incomes which are effectively not indexed to price change. This means that increases in cost can be passed on by industrialists and other producers in the form of higher prices, but these do not necessarily result in higher money wage demands which could lead to spiralling effects on price. This also means that even small changes in price levels can have adverse effects on most wage incomes. It further means that low inflation rates themselves reflect low and possibly falling product wages (as wages decline as a proportion of the total value of the product). These points should be borne in mind in what follows.
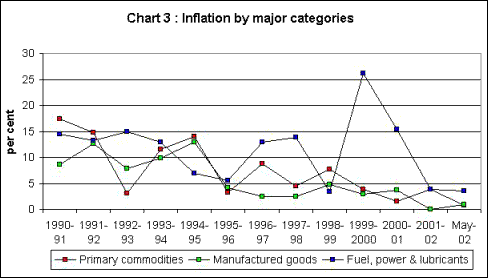
Let us consider first the actual pattern of price change as enumerated by movements in the WPI. This index is dominated by manufactured goods, which account for almost two-third of the weight, as shown in Chart 2. Primary products account for just over one-fifth of the weight, while the remainder refers to fuels, light and lubricants. A decomposition reveals, in Chart 3, that both manufactured goods and primary products have shown substantial deceleration of price changes, creating the overall decline in inflation described earlier. By contrast, fuels, etc., show a much more fluctuating and volatile price pattern with no clear declining trend.

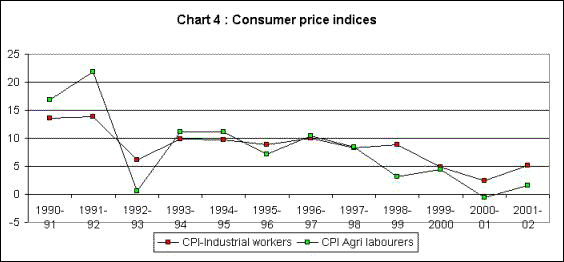
Consumer price indices quite often tend to behave rather differently from the WPI, and this is also the case for the past decade and more in India. Chart 4 shows the movement of these two indices. While the consumer price indices for industrial workers (CPI-IW) and agricultural labourers (CPI-AL) have indeed decelerated compared to the beginning of the 1990s, the slowdown is nowhere as sharp as it has been for the WPI. In fact, the CPI-IW continued to increase briskly until the end of the 1990s.
One of the more obvious reasons for this higher rate of increase in the CPIs, was the importance of food grain and food products in the CPIs. As Chart 5 reveals, the food and foodgrain wholesale price indices tended to move more rapidly than the general index until the end of this period, and do not show the very sharp deceleration evident for the general index. One major reason for this was the progressive opening up of agricultural trade over the 1990s, which brought Indian domestic prices of agricultural products, which were earlier typically lower, closer to world levels. The fact that most world agricultural prices tended to stagnate and fall after 1996 did affect domestic prices, but only subsequently. Also, the government's operations in the foodgrain market prevented sharp downward changes in these prices for most of this period.

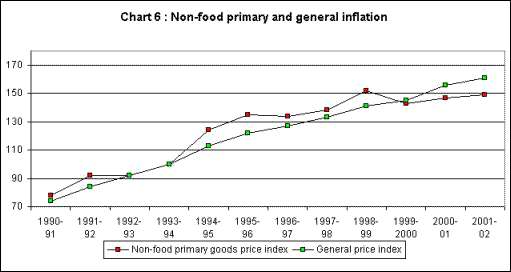
By contrast, non-food primary commodities, which were more directly affected by tendencies in international trade, show much sharper deceleration. In fact, Chart 6 shows that prices of non-food primary commodities actually fell after 1998, and have remained low thereafter.
Most categories of manufactured goods also show substantial slowdown in terms of rates of price change. This is indicated in Chart 7, which suggests that sharp declines in inflation rates occurred for textiles, food products, machinery and other manufacturing categories. In fact, for textiles and food products, prices have declined in absolute terms by the end of the period, from their earlier peaks.
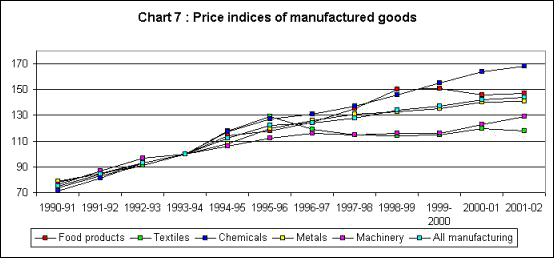
Chart 8 brings all this together in the form of average rates of inflation over two different sub-periods, 1990-91 to 1995-96 and 1995-96 to 2001-02. The annual rate of increase of the general WPI index, which was 10 per cent over the first sub-period, fell to less than half that, at an average of 4.8 per cent over the next sub-period. Food items – and particularly foodgrain – did not slow down in price so substantially. But textile products actually fell in price in the second period, on average. And non-food primary products also decelerated very sharply in terms of inflation. This clearly reflected the effect of low world prices for most such commodities. Next in terms of significance in this regard was machinery, which was probably adversely affected by the falling import prices of similar goods.
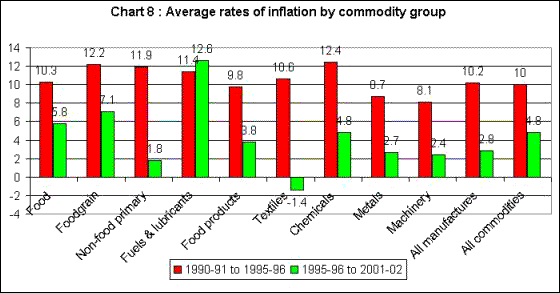
It is worth noting that fuels, light and lubricants actually showed a higher average rate of inflation in the second sub-period compared to the first. This category constitutes an important element of costs for all producers in the economy. Thus, a significant part of costs did not decelerate, and even accelerated in terms of price increase, for most producers, even as prices of final products appeared to decelerate or decline. This implies a squeeze on domestic producers, which would be reflected in falling profit margins or falling wage shares or both.
So in the aggregate, what has caused this very evident decline in inflation? The current mainstream explanations, which are heavily influenced by the monetarist approach, tend to put a lot of emphasis on money supply and the control of central bank lending to the government. According to this position, tighter control over broad money (M3) and limiting the ability of the government to finance its deficits by borrowing cheaply from the Reserve bank of India which would print money in consequence, are the main causes of the overall decline in inflation.
There are of course several problems with this argument at a theoretical level. The monetarist argument is based on the twin assumptions of full employment (or exogenously given aggregate supply conditions) and aggregate money supply determined exogenously by macro policy. Neither of these assumptions is valid. In fact there is a strong case for arguing that in a world of financial innovation where quasi-moneys can be created, the overall liquidity in the system cannot be rigidly controlled by the monetary authorities. Rather, the actual liquidity in the system is endogenously determined.
Therefore the real monetary variable in the hands of the government is the interest rate and thus attempts to control money supply typically end up as forms of interest rate policy instead. Further, the notion of a stable "real demand for money" function (where the demand for money is determined by the level of real economic activity) is one which gets demolished by the possibility of speculative demand for money, a feature which if anything is enhanced by financial sophistication and the greater uncertainties of operating in today's economies.
In any case, the empirical justification for such an argument is also worse than negligible. In fact, there is no clearly discernible relationship between the rates of growth of money supply and of inflation on the one hand, and real output growth on the other. This is evident not only in India, but indeed in all instances elsewhere in the world where monetarist prescriptions have been pursued. The more complex definitions of money that are being developed elsewhere show this very starkly for other countries.
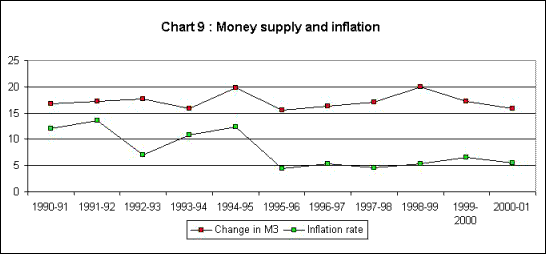
In the recent Indian case, a simple look at the relationship between M3 and inflation rates would indicate immediately that there is no relationship at all. This is shown in Chart 9. While the stock of money (M3) continued to grow at an average rate of around 17 per cent per annum throughout this period, the aggregate inflation rate, as we have already seen, declined quite sharply to less than half of its earlier rate, progressively over the decade.
It would also be quite easy to establish – although this is not brought out through additional data here – that there is no relationship between the fiscal stance and inflation rates. Thus, inflation has declined even though the government's fiscal balance remains at approximately the same level as a proportion of GDP.
Instead of monetary factors, which are clearly irrelevant, what appears to have been more important is a combination of domestic and external forces in the real economy, which are increasingly intertwined now with the greater integration of India with the global economy. The opening up of the Indian economy coincided in the latter half of the decade of the 1990s, with a period of slowdown and recession in international markets.
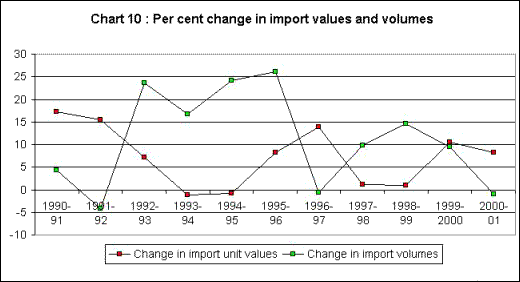
Since 1996, world trade prices and values of major commodity groups has slumped and even declined in some periods. Indeed, deflation is now the order of the day in the most important large economies of the world, including Japan for some time past and even, at present, the United States. This international slowdown has been accompanied by much greater competitive pressure and attempts at explicit and implicit dumping, as producers across the world seek to establish a foothold in what may become a major future market. Thus unit values of imports have tended to fall, as evident in Chart 10. It is also clear that unit values of imports and import volumes are strongly negatively correlated, and that lower import prices have been associated with strong inflows of imports in volume terms.
This international tendency has been coterminous with the increasing liberalisation of external trade, which has affected the domestic price of imported goods and their substitutes. The removal of quantitative restrictions and the gradual lowering of tariff barriers have meant that the price of imported goods has fallen much more sharply within the domestic economy than is reflected by simply the unit values of c.i.f. imports. Obviously, this implies a significant downward pressure on domestic prices, which helps to explain why prices of most manufactured goods have remained low or fallen relative to other prices, despite increases in costs.
Import penetration, along with the lack of a positive stimulus coming from public investment, shifts in income distribution and a number of other factors, have all been associated with domestic recession. In fact, some degree of de-industrialisation is also evident, especially among small scale producers who have been unable to meet the threat of competition from abroad. Not only does such import competition tend to have much greater advertising and marketing power and established brand images, but it is increasingly coming in at lower per unit prices, as explained above. So the sheer possibility of import penetration itself, would have contributed to the control of prices directly through greater import volumes at lower prices, and indirectly its effect on domestic recession.
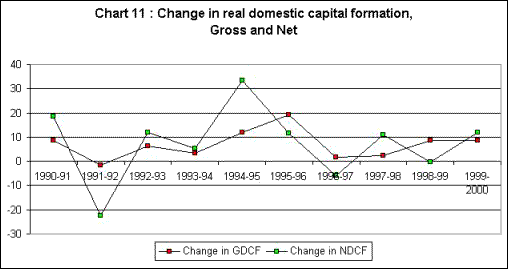
The recession has indeed been probably the most significant factor behind the current slowdown in prices. While there are many indicators of this current recession (including stagnation in industrial output growth, appalling rates of employment generation, falling per capita consumption in many rural areas, etc.) one useful indicator is the strength of capital formation. Chart 11 shows that real changes in gross and net domestic capital formation have been quite volatile over this period, but there is definite evidence of slowdown in the latter half.
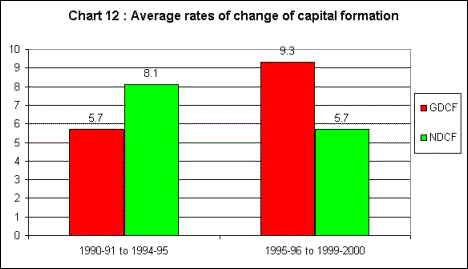
This becomes much more clear from Chart 12, where the average rates of increase are provided over the two sub-periods. The rate of change of net capital formation in real terms has fallen (in terms of annual averages) very sharply from nearly 10 per cent in the first sub-period, to just above 5 per cent in the second.
All these indicators therefore suggest that the dominant cause of the decline in inflation rates has been the slowdown in the real economy, combined with the effect of cheaper imports at a time when internationally as well, prices are stagnant or falling. This is a situation as perilously close to deflation as it is possible to get.
Of course deflation has been largely unknown in India over its post-Independence history, and so there is little experience which can be sifted to provide instruction about how to deal with such a potential situation. What is clear, however, is that the current very low rate of inflation is not therefore a cause for celebration, but much more a source of concern. In addition, it is likely that this reflects shifts in income distribution which are more inequalising as well.
What is required in this context is much more active intervention by the government, in terms of increased productive spending, to lift the economy out of recession. A small increase in the price level as a result of this could even be welcome it is associated with more growth and employment generation in the system.

How did such a process occur? And what were the main elements of this decline in terms of different product categories? The government has been quick to claim the credit for this tendency, arguing that this speaks for the success of its economic strategy. But this is probably misleading. Indeed, the overall recessionary context within which this is occurring suggests that the real causes of declining inflation may simply be macroeconomic and international tendencies which reflect weakness in the Indian economy, rather than strength.
It should be noted that, since inflation in economies operating below full employment is the macro-economic effect of the struggle over distributive shares, in a sense changing rates of inflation reflect the changing balance of class forces in an economy. In the Indian economy, inflation has always been relatively low by international standards, and certainly well below the inflationary tendencies so commonly found in the Latin American countries, for example.
This is primarily because most of the workers and agriculturalists in the country have incomes which are effectively not indexed to price change. This means that increases in cost can be passed on by industrialists and other producers in the form of higher prices, but these do not necessarily result in higher money wage demands which could lead to spiralling effects on price. This also means that even small changes in price levels can have adverse effects on most wage incomes. It further means that low inflation rates themselves reflect low and possibly falling product wages (as wages decline as a proportion of the total value of the product). These points should be borne in mind in what follows.
Let us consider first the actual pattern of price change as enumerated by movements in the WPI. This index is dominated by manufactured goods, which account for almost two-third of the weight, as shown in Chart 2. Primary products account for just over one-fifth of the weight, while the remainder refers to fuels, light and lubricants. A decomposition reveals, in Chart 3, that both manufactured goods and primary products have shown substantial deceleration of price changes, creating the overall decline in inflation described earlier. By contrast, fuels, etc., show a much more fluctuating and volatile price pattern with no clear declining trend.


Consumer price indices quite often tend to behave rather differently from the WPI, and this is also the case for the past decade and more in India. Chart 4 shows the movement of these two indices. While the consumer price indices for industrial workers (CPI-IW) and agricultural labourers (CPI-AL) have indeed decelerated compared to the beginning of the 1990s, the slowdown is nowhere as sharp as it has been for the WPI. In fact, the CPI-IW continued to increase briskly until the end of the 1990s.

One of the more obvious reasons for this higher rate of increase in the CPIs, was the importance of food grain and food products in the CPIs. As Chart 5 reveals, the food and foodgrain wholesale price indices tended to move more rapidly than the general index until the end of this period, and do not show the very sharp deceleration evident for the general index. One major reason for this was the progressive opening up of agricultural trade over the 1990s, which brought Indian domestic prices of agricultural products, which were earlier typically lower, closer to world levels. The fact that most world agricultural prices tended to stagnate and fall after 1996 did affect domestic prices, but only subsequently. Also, the government's operations in the foodgrain market prevented sharp downward changes in these prices for most of this period.

By contrast, non-food primary commodities, which were more directly affected by tendencies in international trade, show much sharper deceleration. In fact, Chart 6 shows that prices of non-food primary commodities actually fell after 1998, and have remained low thereafter.

Most categories of manufactured goods also show substantial slowdown in terms of rates of price change. This is indicated in Chart 7, which suggests that sharp declines in inflation rates occurred for textiles, food products, machinery and other manufacturing categories. In fact, for textiles and food products, prices have declined in absolute terms by the end of the period, from their earlier peaks.

Chart 8 brings all this together in the form of average rates of inflation over two different sub-periods, 1990-91 to 1995-96 and 1995-96 to 2001-02. The annual rate of increase of the general WPI index, which was 10 per cent over the first sub-period, fell to less than half that, at an average of 4.8 per cent over the next sub-period. Food items – and particularly foodgrain – did not slow down in price so substantially. But textile products actually fell in price in the second period, on average. And non-food primary products also decelerated very sharply in terms of inflation. This clearly reflected the effect of low world prices for most such commodities. Next in terms of significance in this regard was machinery, which was probably adversely affected by the falling import prices of similar goods.

It is worth noting that fuels, light and lubricants actually showed a higher average rate of inflation in the second sub-period compared to the first. This category constitutes an important element of costs for all producers in the economy. Thus, a significant part of costs did not decelerate, and even accelerated in terms of price increase, for most producers, even as prices of final products appeared to decelerate or decline. This implies a squeeze on domestic producers, which would be reflected in falling profit margins or falling wage shares or both.
So in the aggregate, what has caused this very evident decline in inflation? The current mainstream explanations, which are heavily influenced by the monetarist approach, tend to put a lot of emphasis on money supply and the control of central bank lending to the government. According to this position, tighter control over broad money (M3) and limiting the ability of the government to finance its deficits by borrowing cheaply from the Reserve bank of India which would print money in consequence, are the main causes of the overall decline in inflation.
There are of course several problems with this argument at a theoretical level. The monetarist argument is based on the twin assumptions of full employment (or exogenously given aggregate supply conditions) and aggregate money supply determined exogenously by macro policy. Neither of these assumptions is valid. In fact there is a strong case for arguing that in a world of financial innovation where quasi-moneys can be created, the overall liquidity in the system cannot be rigidly controlled by the monetary authorities. Rather, the actual liquidity in the system is endogenously determined.
Therefore the real monetary variable in the hands of the government is the interest rate and thus attempts to control money supply typically end up as forms of interest rate policy instead. Further, the notion of a stable "real demand for money" function (where the demand for money is determined by the level of real economic activity) is one which gets demolished by the possibility of speculative demand for money, a feature which if anything is enhanced by financial sophistication and the greater uncertainties of operating in today's economies.
In any case, the empirical justification for such an argument is also worse than negligible. In fact, there is no clearly discernible relationship between the rates of growth of money supply and of inflation on the one hand, and real output growth on the other. This is evident not only in India, but indeed in all instances elsewhere in the world where monetarist prescriptions have been pursued. The more complex definitions of money that are being developed elsewhere show this very starkly for other countries.
In the recent Indian case, a simple look at the relationship between M3 and inflation rates would indicate immediately that there is no relationship at all. This is shown in Chart 9. While the stock of money (M3) continued to grow at an average rate of around 17 per cent per annum throughout this period, the aggregate inflation rate, as we have already seen, declined quite sharply to less than half of its earlier rate, progressively over the decade.

It would also be quite easy to establish – although this is not brought out through additional data here – that there is no relationship between the fiscal stance and inflation rates. Thus, inflation has declined even though the government's fiscal balance remains at approximately the same level as a proportion of GDP.
Instead of monetary factors, which are clearly irrelevant, what appears to have been more important is a combination of domestic and external forces in the real economy, which are increasingly intertwined now with the greater integration of India with the global economy. The opening up of the Indian economy coincided in the latter half of the decade of the 1990s, with a period of slowdown and recession in international markets.
Since 1996, world trade prices and values of major commodity groups has slumped and even declined in some periods. Indeed, deflation is now the order of the day in the most important large economies of the world, including Japan for some time past and even, at present, the United States. This international slowdown has been accompanied by much greater competitive pressure and attempts at explicit and implicit dumping, as producers across the world seek to establish a foothold in what may become a major future market. Thus unit values of imports have tended to fall, as evident in Chart 10. It is also clear that unit values of imports and import volumes are strongly negatively correlated, and that lower import prices have been associated with strong inflows of imports in volume terms.

This international tendency has been coterminous with the increasing liberalisation of external trade, which has affected the domestic price of imported goods and their substitutes. The removal of quantitative restrictions and the gradual lowering of tariff barriers have meant that the price of imported goods has fallen much more sharply within the domestic economy than is reflected by simply the unit values of c.i.f. imports. Obviously, this implies a significant downward pressure on domestic prices, which helps to explain why prices of most manufactured goods have remained low or fallen relative to other prices, despite increases in costs.
Import penetration, along with the lack of a positive stimulus coming from public investment, shifts in income distribution and a number of other factors, have all been associated with domestic recession. In fact, some degree of de-industrialisation is also evident, especially among small scale producers who have been unable to meet the threat of competition from abroad. Not only does such import competition tend to have much greater advertising and marketing power and established brand images, but it is increasingly coming in at lower per unit prices, as explained above. So the sheer possibility of import penetration itself, would have contributed to the control of prices directly through greater import volumes at lower prices, and indirectly its effect on domestic recession.
The recession has indeed been probably the most significant factor behind the current slowdown in prices. While there are many indicators of this current recession (including stagnation in industrial output growth, appalling rates of employment generation, falling per capita consumption in many rural areas, etc.) one useful indicator is the strength of capital formation. Chart 11 shows that real changes in gross and net domestic capital formation have been quite volatile over this period, but there is definite evidence of slowdown in the latter half.

This becomes much more clear from Chart 12, where the average rates of increase are provided over the two sub-periods. The rate of change of net capital formation in real terms has fallen (in terms of annual averages) very sharply from nearly 10 per cent in the first sub-period, to just above 5 per cent in the second.

All these indicators therefore suggest that the dominant cause of the decline in inflation rates has been the slowdown in the real economy, combined with the effect of cheaper imports at a time when internationally as well, prices are stagnant or falling. This is a situation as perilously close to deflation as it is possible to get.
Of course deflation has been largely unknown in India over its post-Independence history, and so there is little experience which can be sifted to provide instruction about how to deal with such a potential situation. What is clear, however, is that the current very low rate of inflation is not therefore a cause for celebration, but much more a source of concern. In addition, it is likely that this reflects shifts in income distribution which are more inequalising as well.
What is required in this context is much more active intervention by the government, in terms of increased productive spending, to lift the economy out of recession. A small increase in the price level as a result of this could even be welcome it is associated with more growth and employment generation in the system.
© MACROSCAN 2002