It
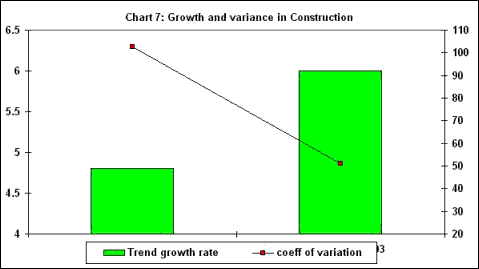
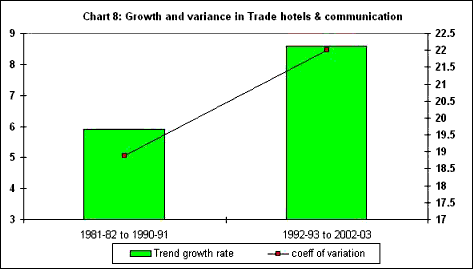
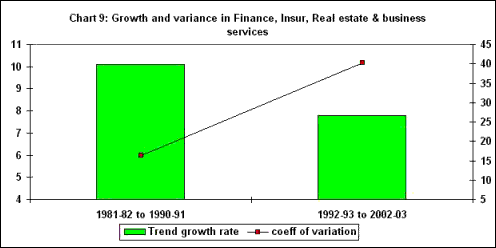
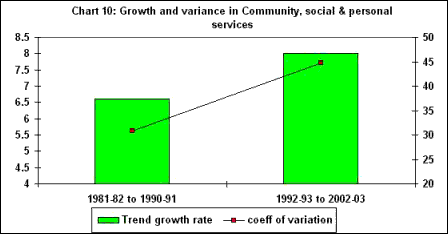
is only the services sub-sectors, described in Charts
7 to 10, that suggested any increase in rates of growth,
and that is primarily why GDP growth in the aggregate
has remained respectable. Even here, however, financing,
insurance, real estate and business services registered
a significant slowdown. Also, the acceleration in
output growth of community, social and personal services
may not reflect a real increase so much as the increase
in public sector wages that occurred over this period
because of the Pay Commission awards.
Chart
7 >> Click
to Enlarge
Chart
8 >> Click
to Enlarge
Chart
9 >> Click
to Enlarge
Chart
10 >> Click
to Enlarge
What
explains this general deceleration in output growth
in most sectors? The RBI report suggests that this
reflects the more significant slowdown that has occurred
after 1996, and therefore breaks down the post-reform
period into three sub-periods for more detailed consideration.
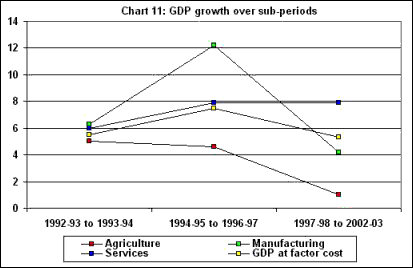
Chart
11 gives some idea of this. It is clear that agricultural
deceleration was the most advanced, with GDP growth
in agriculture in the final five-year period averaging
only 1 per cent per annum. But even manufacturing
shows a sharp slowdown, falling in the last five years
to only 4.2 per cent per annum-one of the lowest trend
rates of growth experienced for Indian manufacturing
in any period since the 1950s.
Chart
11 >> Click
to Enlarge
The stability of services growth
over this period was clearly inadequate to counter
these recessionary trends, which is why the period
1997–98 to 2002–03 also shows aggregate GDP growth
at a lower rate of 5.3 per cent.
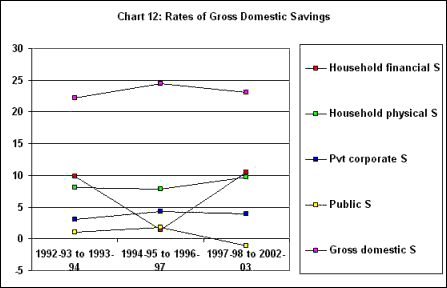
Over this later period, savings rates also declined
on average. Chart 12 indicates that this was primarily
due to the collapse of public sector savings, as the
public sector became a net dissaver. Indeed, savings
was kept afloat essentially by the household sector,
since private corporate savings also declined as a
share of GDP over this period.
Chart
12 >>
Click
to Enlarge
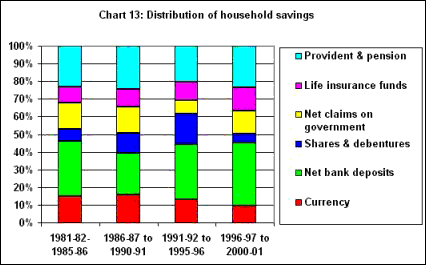
Chart
13 takes a closer look at the distribution of household
financial savings over the various five-year periods
since the early 1980s. A number of features emerge
from this chart. Currency has been declining as a
share of total household financial savings, while
more secure financial instruments have been gradually
increasing. These include life insurance funds and
net claims to the government (the so-called 'small
savings').
Chart
13 >> Click
to Enlarge
Significantly, bank deposits have been growing in
proportion throughout this period. Stockmarket instruments-shares
and debentures-increased in the early 1990s, but after
the stockmarket scam, households clearly decided to
stick to less risky forms of saving. By the last sub-period
they accounted for only 5 per cent of household financial
instruments. The swing away from such stockmarket
instruments clearly seems to have benefited small
savings in the last period.
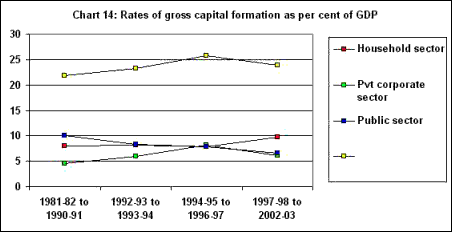
Investment
rates also declined on average in the last sub-period,
as illustrated by Chart 14. Interestingly, the decline
in investment showed both public and private sector
investment deceleration, while the household sector
actually increased its investment (which is the same
as its physical savings). This is but another reflection
of the increasing slack, or unemployment and underutilization
of resources, in the macroeconomy, that has already
been mentioned.
Chart
14 >> Click
to Enlarge
Public sector investment was constrained by the falling
tax–GDP ratios and the official perception that fiscal
deficits needed to be contained, which meant cutbacks
on public capital expenditure. There is no surprise
in the associated decline in private corporate investment
rates-the strong positive link between public and
private investment in India (and indeed in most developing
countries) is by now well-established, and the fact
of recessionary tendencies in the economy during this
period is also widely accepted.
The
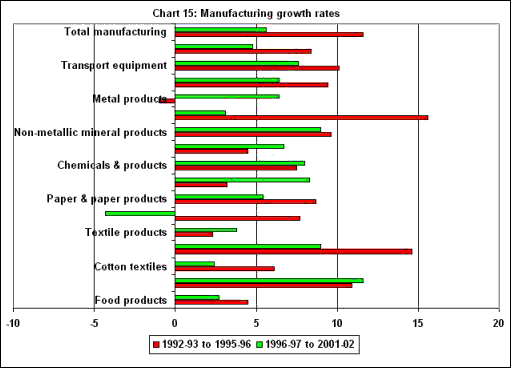
slowdown in manufacturing deserves closer attention.
As Chart 15 shows, such deceleration was spread across
a very wide range of manufacturing sub-sectors. So
much so that only five sub-sectors appear to have
bucked the adverse trend: beverages and tobacco, textile
products, leather, chemicals and rubber, plastics
petroleum and coal. For most of traditional manufacturing,
as well as for the range of capital goods industries,
the falls in growth rate were actually quite steep.
Chart
15 >> Click
to Enlarge
The RBI report considers at some length the various
hypotheses advanced to explain the deceleration. It
mentions the argument that has been advanced by Macroscan
earlier, that the slowdown reflected the satiation
of pent-up demand once the initial spurt of import-intensive
production had dealt with post-liberalization consumer
demand. Once that once-for-all increase had been catered
to, manufacturing faced a recession in the absence
of any further demand impetus, either from the domestic
economy or through exports. This was aided by the
fact that the initial early 1990s' expansion had not
greatly increase employment, and so had limited linkage
and multiplier effects.
The
RBI appears to reject this argument, on the grounds
that 'the huge capacity build up noticed in the first
phase of reform runs counter to the monetary surge
in demand that was not likely to be sustained in the
long run' (pages III–30). However, this counter-argument
is weak at best, and is actually contradicted by the
data provided in the very same report, on capital
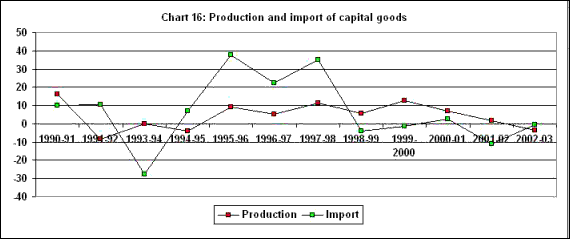
goods production and import. It will be seen from
Chart 16, that both domestic production and imports
of capital goods really increased in the middle of
the 1990s, and peaked by 1997–98, when the onset of
domestic recession from 1996 finally dampened investor
expectations. Since then, both production and imports
of capital goods have been relatively depressed, indicating
that investor expectations have yet to recover in
the absence of any stimulus either from the government
or from the external sector.
Chart
16 >> Click
to Enlarge
In addition, the report argues
that the fall in government investment does not per
se provide a satisfactory explanation of the slowdown,
since government productive expenditure also declined
during the short-lived boom. But that is precisely
the point: that after that initial import-led consumption
boom was over, the slowdown in government investment
made things worse because there was no additional
stimulus to private investment.
In contrast, the other explanations that have been
offered for the manufacturing slowdown, which are
apparently taken more seriously by the report, are
almost laughable. The first relates to the 'credit
crunch' faced by the corporate sector during 1995–96,
when the RBI made large dollar sales to contain foreign
currency market volatility. This could hardly explain
the continued depression in investment until 2002–03.
The important point about the credit market, which
is not made in the report, is that the reduced
access of small-scale industry to formal credit after
financial deregulation has dramatically weakened its
position and contributed substantially to the slowdown.
Similarly, the report argues that 'the proportion
of corporate funds locked up in inventories and receivables
went up steadily, leading to a scarcity of working
capital' (pages III–30). This argument surely mistakes
cause for effect-the increase in inventories is typically
a sign of recession, not a factor determining it.
The report also mentions the role of cyclical factors,
such as the lagged effect of low agricultural growth
and the depressed international economic context.
What it fails to mention is that it is precisely in
such circumstances that expansion must come from government
expenditure.
This reflects the basic constraint within which the
report has been written, that it is operating very
much within the paradigm of the marketist neo-liberal
reform that the policy-makers in the Finance and other
ministries have adopted. In the circumstances, it
is hardly surprising that the Report is unable, despite
its apparent intentions, actually to offer an objective
assessment of the Indian reform experience.

