However,
rates of productivity growth (defined here as rate
of change in value added per employee in constant
price terms) appear to be almost inversely related
to employment expansion. This needs to be understood
more closely. An inverse relation between employment
and productivity is quite common in many sectors,
especially in primary production, and is even to be
expected. However, where increasing returns are thought
to prevail (and especially where dynamic returns,
as exemplified in Verdoorn's Law which posits a positive
relation between rates of output growth and productivity
growth) a positive relation would be more expected.
These particular manufacturing sectors – electrical
machinery, etc. - are generally thought to be characterised
by strong increasing returns to scale, especially
in the dynamic sense. Therefore this apparent (although
clearly not uniform) inverse relation is of some interest.
An exactly similar pattern prevails in developed industrial
countries for this sector (Chart 8), suggesting that
this is not a pattern specific to developing country
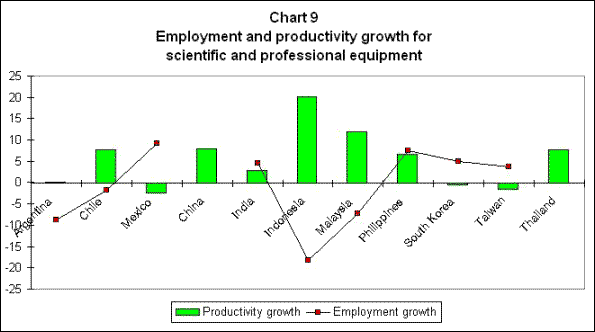
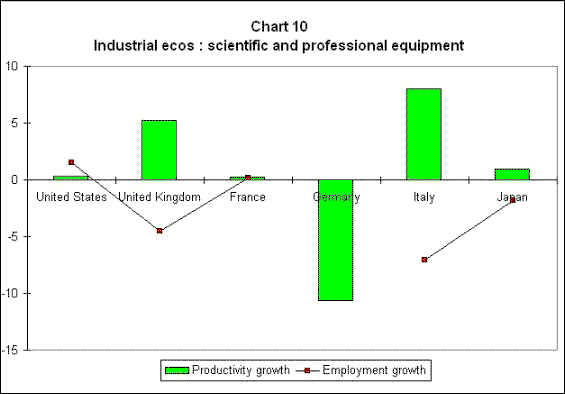
producers in this sector. Charts 9 and 10 suggest
that similar inferences can be made also for the category
of "scientific and professional equipment"
production in developing and developed countries.

Chart
9 >> Click
to Enlarge

Chart
10 >> Click
to Enlarge
What all this implies is that these sectors – at least
over the period under question – were not characterised
by dynamic increasing returns in the sense that is
usually meant, and that there was therefore a clear
trade-off between employment growth and productivity
growth. Insofar as there was high employment growth
in some countries in these broad sectors, it reflected
lower rates of labour-saving technological change
as much as demand-led expansion.
The other major categories in which developing country
manufactured exports have grown significantly and
in which developing countries as a whole have increased
their shares of world markets, are plastic products
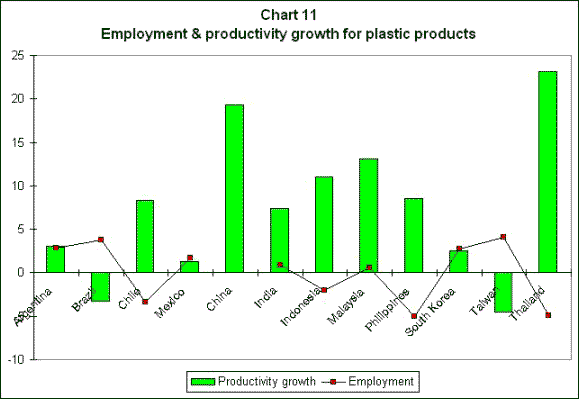
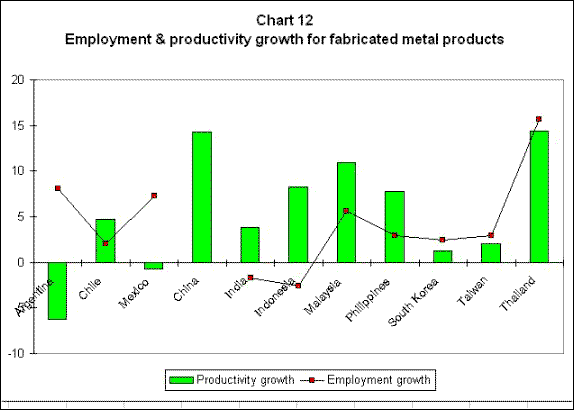
and fabricated metal products. Charts 11 and 12 show
employment and productivity growth for major developing
country exporters. Once again, the inverse relation
appears to operate, barring some spectacular outliers
such as Thailand in the case of fabricated metal products
(in which the high rates of employment and productivity
growth are both upon low bases).

Chart
11 >> Click
to Enlarge

Chart 12 >> Click
to Enlarge
What is especially notable is that in all of these
supposedly dynamic developing country export sectors,
only a handful of countries - and that too, mainly
confined to the East/Southeast Asian region – showed
very high rates of employment expansion over this
period. These were Malaysia, Indonesia, Philippines,
and most of all China. Indeed, because China shows
relatively high rates of growth of employment, all
of which reflect the already huge base of manufacturing
employment, it alone accounts for the vast bulk of
job creation among all developing countries over this
period. And, as we have already mentioned, this very
large increase in turn was associated with the fact
of import regulation and state control for China's
domestic manufacturing sector over most of this period.
In sum, the evidence on developing country manufacturing
employment, even in the sectors supposedly associated
with the highest rates of export expansion and industrial
relocation, suggests that net increases in employment
generation have been concentrated in very few countries.
Most developing countries have actually experienced
stagnation or even declines in aggregate manufacturing
employment.
This in turn reflects technological changes which
lead to greater use of labour-saving methods of production
which are expressed in high rates of productivity
growth in some countries. And this may result from
the greater competitive pressures, which have come
about simply because of the combination of increased
concentration of production and need to generate higher
export revenues across all developing countries.

