|
The
charts immediately suggest that any ICOR calculations
would produce highly volatile and questionable results
for the different sectors over the period in question.
In all of the sectors, output (that is GDP by sector)
has been quite volatile and estimates of ICOR would
be quite problematic.
Consider the case of agriculture, described in Chart
6. This is one of the few sectors to show a definite
increase in investment over this period. Despite this,
however, GDP in this sector has fluctuated very significantly,
and certainly show no positive time trend.
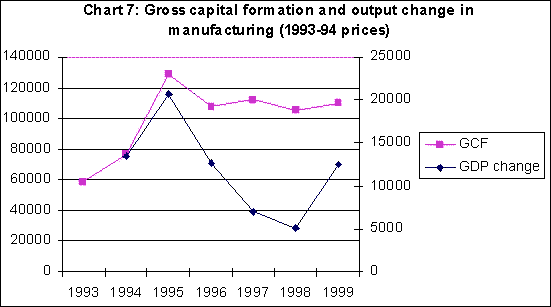
In manufacturing, described in Chart 7, there has been
a definite stagnation and even decline in investment
after 1994-95. This is noteworthy because it suggests
that the deceleration investment in this sector began
before the industrial recession which is typically
dated from around the middle of 1996. The changes in
GDP in manufacturing appear to be even sharper than
those in investment in this sector.
Chart
7 >> Click
to Enlarge
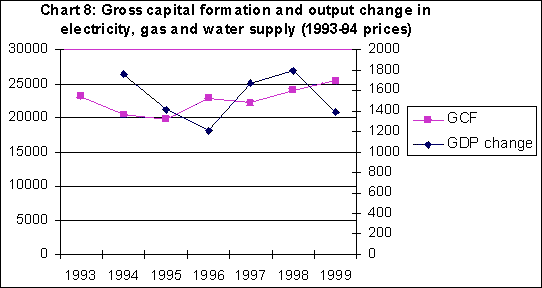
Investment in the infrastructure sectors of electricity,
gas and water, shown in Chart 8, appear to have increase
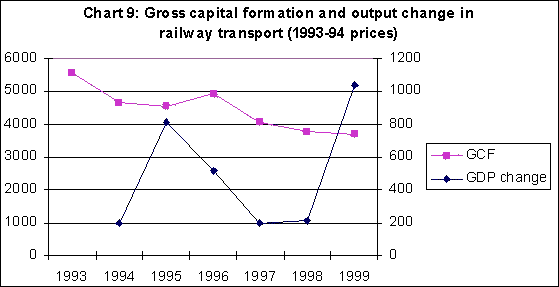
since 193-94 in real terms. However, railway investment
has slumped dramatically, as indicated in Chart 9. Since
railways remains among the most significant means of
goods traffic in the country, besides serving the transport
needs of the bulk of the population, this collapse in
railway investment is a real source of concern. By contrast,
the railways does not appear to have performed quite
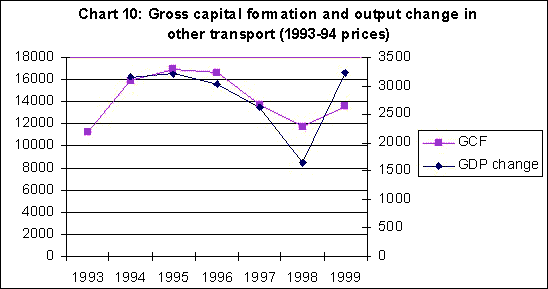
so poorly in terms of GDP growth. However, not just
the railways but even other transport sectors appear
to have been hit by falling real investment since 1993-94.
They show a declining trend in investment (Chart
10) except for the last year, and it must be borne in
mind that the data for the last year are still provisional
and subject to substantial change going by past experience.
Chart
8 >> Click
to Enlarge
Chart
9 >> Click
to Enlarge
Chart
10 >> Click
to Enlarge
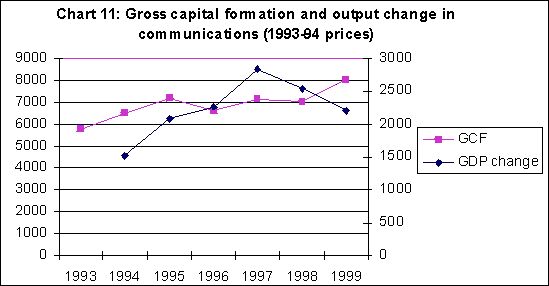
The opposite tendency from railways seems to at work
in the communications sector, for which the data are
displayed in Chart 11. Here, as expected, capital formation
has been quite strong and growing in real terms, but
output expansion seems to be less dynamic than would
be indicated by the dynamism of investment.
Chart
11 >> Click
to Enlarge
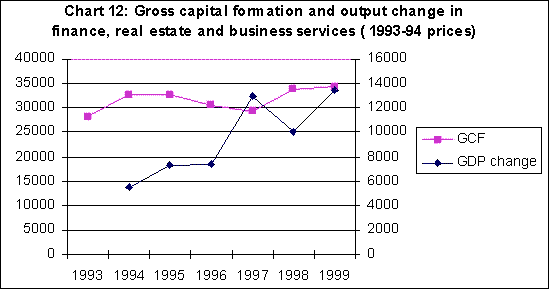
Finance was for a time a booming sector, and in any
case in economies where there is an initial phase of
financial liberalisation there tends to be a temporary
boom in financial and business services as well as in
real estate. Therefore it is not surprising that investment
in these sectors increased in real terms as shown in
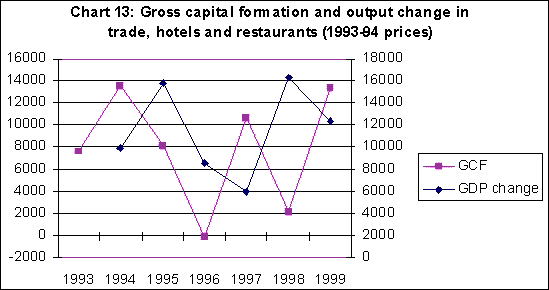
Chart 12, despite a slump over 1996-97. However, there
appear to be no significant time trend for investment
in trade, hotels and restaurants (Chart 13), which show
extreme volatility both in investment and in changes
in output over this period.
Chart
12 >> Click
to Enlarge
Chart
13 >> Click
to Enlarge
The overall picture, then, is one of relatively sluggish
investment despite the slight increase in investment
rates which is part of a longer time trend. It is of
even greater concern that most of the new investment
appears to have come in recent years from private household
investment, as corporate investment has stagnated and
public investment has actually fallen. These tendencies
bode ill for future growth prospects unless the overall
macroeconomic strategy of the government is completely
reversed from that which has dominated over the past
decade. |

