Themes > Features
16.05.2000
Rainfall, Drought and Agricultural Output
Media
discussion of weather conditions over the past few weeks has focused
on drought - not only the drought that has already occurred in certain
parts of the country such as the western and central regions, but also
the possibility of more widespread drought following upon the possibility
of a poor monsoon in the coming crop season.
This has brought back into focus a relationship that had been increasingly ignored over the past few years : the role of weather conditions in general, and rainfall in particular, in affecting agricultural output. There was a time when the idea that Indian crop output was a (volatile) gift of the monsoon rains, was taken for granted, and three to four year "monsoon cycles" were used to explain cyclical fluctuations in total agricultural output as well. And, a complex system of contingency planning for drought had been developed, both to make the impact on production less through seed availability of drought resistant varieties and through protective irrigation, and to lessen the human suffering through food-for-work responses. These had last been at work in 1987 when the worst drought in post-independence years had been tackled so well as to lead not only to much less suffering than earlier, but to a production effort which led both to a less adverse effect than expected in 1987 and a much sharper increase in production than normal in 1988. But over the 1990s, these relationships between weather, production and welfare, and particularly the role of the state in all this, had become ever less prominent in public perception.
There are some who have argued that Indian agriculture - kharif output in particular - has finally freed itself from the earlier almost total dependence on the monsoon, due to increased spread of irrigation, changed cropping patterns and other technological changes. Others have been more sceptical, suggesting that this is more a result of the unusually prolonged munificence of the weather gods for more than a decade now, with average monsoon rainfall across the country falling within the "normal" range since 1988.
The answer to this question becomes especially significant now, as drought conditions are already evident in states like Rajasthan, Gujarat and Andhra Pradesh, and when currently available predictions, although not yet of the Meteorological Department, suggest that this year's monsoon rain may be less than normal. This is why it is worth examining past trends in rainfall by state and crop, and considering what implications these may have for assessing the potential effect of the coming monsoon on the kharif output.
Of course, the prior question is naturally : to what extent should we place faith in the predictions of the Indian Meteorological Department (IMD) ? Chart 1 plots the rainfall predictions of the IMD against the actual rainfall patterns from 1988. It is evident that IMD provided very accurate predictions until around 1993, and that subsequently both the extent and the direction of changes in actual rainfall have diverged from those predicted. However, both the predictions and the actuals have fallen within the "normal" range (that is, within 10 per cent of the estimated norm) and so the discrepancies in prediction have not really been noticed.

The various charts of Chart 2 plot the behaviour of actual monsoon rainfall (that is, over the entire period of June-September in each year) by states, against the all-India average. This provides some idea of the variation across states, as well, as the degree of fluctuation in rainfall by states. Some interesting insights can be gained from these charts.


Thus, while it is inevitable that individual states would experience higher volatility than the national average, it is interesting that the coefficient of variation of monsoon rainfall, which was only 8 per cent at the national level during 1986 to 1999, had ranged from 10 to 40 per cent in the major states. During 1986 to 1999, rainfall variability as measured by its coefficient of variation was highest in Haryana (40 per cent), Gujarat (35.4 per cent), Rajasthan (31.7 per cent) and Punjab (30.9 per cent). But since Punjab and Haryana have almost wholly irrigated agriculture, the effect of the large rainfall variability is muted on production, leaving Gujarat and Rajasthan as the states where monsoon variability has had most effect on agricultural production. This is, of course, nothing new since this region has historically had the highest rainfall variability and had developed responses, including cropping patterns, to cope with this. What is, however, noticeable about this period is that certain other states which traditionally have had high rainfall variability, such as Karnataka, Madhya Pradesh, Maharastra and Orissa, all had low coefficients of rainfall variation during 1986-99 at 10.4, 16.2, 13.9 and 16 per cent respectively. Among the other states, Andhra Pradesh (22.5 per cent), Bihar (18 per cent), and Tamil Nadu (23 per cent) have had relatively high rainfall variation, while Assam (15.2 per cent), Kerala (16.6 per cent), Uttar Pradesh (14.1 per cent), and West Bengal (12.3 per cent) have had relatively low variation.
What also matters for the effect of rainfall on crop production at the all-India level is the degree to which rainfall variations across states are correlated with each other, since if the correlation is positive and high the variations at state level are likely to reinforce each other while they could cancel each other if the correlation is negative. As the charts show, there is in most cases a positive correlation between the state-specific and the all-India indices. This positive correlation is high (ie correlation coefficient greater than 75 per cent) in the case of Gujarat, Haryana, Karnataka, Maharashtra, Punjab and Uttar Pradesh. but is low (ie correlation coefficient less than 30 per cent) in the case of Assam, Bihar, Kerala, Orissa, Tamil Nadu. For Andhra Pradesh, Madhya Pradesh and Rajasthan, the correlation between the state-specific and all-India indices lie between 40 and 50 per cent, also indicating relatively low correlation. And, in the case of West Bengal the correlation is in fact negative. Thus, it may be said that there are two basic reasons why the all-India rainfall has been more stable since 1988: first, the rainfall pattern in the East and the South (excluding Karnataka) has had very low correlation with the rest of the country, and, second, certain traditionally high variation states (ie Karnataka, Madhya Pradesh, Maharashtra and Orissa have had relatively low rainfall variations. In addition, it must be noted that there was not a single year since 1988 when rainfall was less than 80 per cent of normal in Andhra Pradesh, Karnataka, Madhya Pradesh, Maharashtra, Punjab and West Bengal; and in Bihar, Rajasthan and Uttar Pradesh rainfall has not fallen below 80 per cent of normal since 1992.
The fact that monsoon rainfall in Rajasthan has not been deficient (ie. less than 80 per cent of normal) in any year since 1991, including in 1999, runs totally counter to certain common perceptions which are current today, given the huge media hype. Thus, much has been made of the drought conditions said to have been prevailing in Rajasthan and Gujarat over the past two years. But, as the Charts show, while there has been a decline in rainfall in these two states compared to the national average in 1999, this was not the case in 1998. The monsoon precipitation during 1998 was exactly normal in both the meteorological sub-divisions of Rajasthan and was 20 per cent and 8 per cent excess in the Gujarat and Saurashtra, Kutch and Diu divisions. Winter and pre-monsoon rainfall during 1999 was also more than normal in West Rajasthan and the Saurashtra-Kutch-Diu subdivisions. These two sub-divisions, which the media has claimed to have had the worst drought in a century did have deficient monsoon rainfall in 1999, and in Gujarat the winter rainfall in 2000 was also scanty. But the rainfall situation in both states this year has certainly been much better than in 1987, and, especially in Rajasthan, was also better than in 1991. In fact, it is other states - Kerala and Tamil Nadu - which experienced more significant declines in monsoon rainfall in 1999, but these have not received equivalent attention.
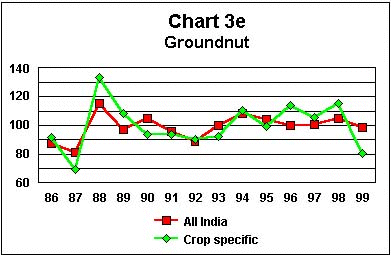
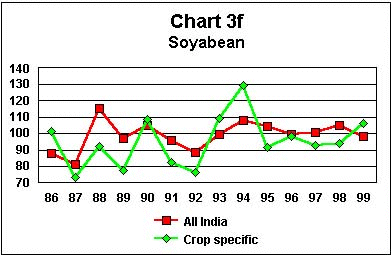
Another way of considering the information on monsoon rainfall is to consider it in relation to the kharif crops produced. Charts 3a to 3g provide data on this, in terms of the rainfall patterns in areas devoted to the cultivation of the major kharif crops. 3a shows the rainfall pattern for rice-growing areas. It is clear that this is close to the national average for the season, which is only to be expected because rice is such a major kharif crop spread over so many parts of the country. But it is also worth noting that the monsoon rainfall even in the relatively bad year of 1999 was well within normal levels. In fact, the extent of volatility of rainfall appears to have fallen over the decade of the 1990s as far as the rice-growing area is concerned.


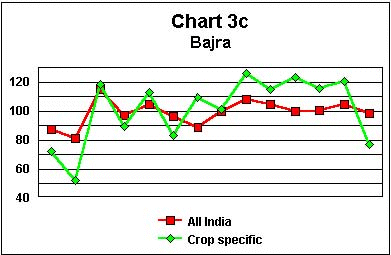
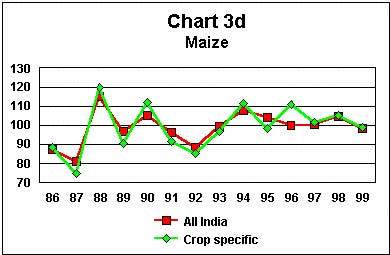
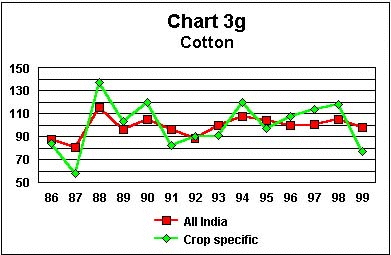
As Chart 3b shows, the national average also tracks the behaviour of rainfall for the jowar-growing areas very well, although the peaks and troughs are sharper than for the national average. The same is true of maize, as shown in Chart 3d. For bajra, by contrast, Chart 3c indicates the crop-specific rainfall to be much more volatile, with less relation to the national average, higher levels of rainfall in the period from 1993 to 1998 and a more significant decline in 1999. In fact, for this crop, the movement is dominated by the rainfall pattern in Rajasthan which it has already been noted is not too strongly correlated with the all-India pattern.
In the case of areas devoted to the cultivation of oilseeds - specifically groundnut and soya bean - the pattern is quite different. In the case of soya bean this is related to the fact that the area under this crop is chiefly in the single state of Madhya Pradesh, while groundnut cultivation also in mainly in a few western and central states. In fact, rainfall patterns in the groundnut and cotton growing areas turn out to be strikingly similar, reflecting in essence the weight of Gujarat, and also Andhra Pradesh, Maharashtra and Tamil Nadu, in the area and production of these crops.
The most crucial question is not about the pattern of rainfall alone, but the extent to which it in turn affects agricultural output. This is the issue that is sought to be answered in the data provided in Table 1, which provides information based regression exercises for the crop-specific data, relating rainfall, output and yield for the major kharif crops. The table gives the elasticities of production and yield with respect to rainfall, for the seven crops for the period 1986 to 1999.

As the table shows, bajra cultivation appears to have been the most dependent upon rainfall, with an elasticity of 0.92 for production and 0.65 for yield, with respect to rainfall. Since bajra is one of the more important coarse cereals produced in kharif, and since this is also one which has experienced a sharp drop in rainfall in 1999, this result assumes significance. The other crop which shows a very high responsiveness in groundnut, with elasticities of 0.81 and 0.54 for production and yield respectively.
The major kharif crop, rice, also appears to have a relatively high degree of responsiveness to rainfall. The elasticity of output with respect to rainfall was nearly 0.5, while that of yield was more than 0.3 - important because so much of kharif output depends upon this single crop. However, since as was observed from Chart 3a, the fluctuations in the crop-specific monsoon rainfall for rice have been relatively low and increasingly dampened, this may not have mattered so very much in the recent past. However, if there is for some reason a sharp drop in rice area-specific rainfall in the coming monsoon, this could have serious implications for rice production.
Most of the other kharif crops appear to have rather low responsiveness to rainfall indicators, suggesting that production and yield are largely determined by other factors. But it would not be safe to conclude from this that cultivation of these crops is based on greater reliance on irrigation or new techniques which make the impact of rainfall minimal. Such a conclusion is immediately refuted by the example of jowar, for which the elasticities of production and yield with respect to rainfall are near zero, but which is still mainly cultivated through rain-fed traditional techniques.
So what are the prospects if monsoon rainfall does turn out to be below normal in 2000, as is being predicted in certain quarters? This depends on whether the low correlation between the North and West on the one hand and the South and East on the other persists, and on how much the all-India monsoon drops. If the other parameters observed during the 1990s continues, the answer seems to be that there is no reason to expect any catastrophic drop in output even if the prediction of the Centre for Mathematical Modelling, Bangalore, as regards the all-India monsoon comes true. There is reason for gearing up contingency plans, particularly in Karnataka, Maharashtra and Uttar Pradesh, in addition to strengthening current efforts in Gujarat, Rajasthan and Andhra Pradesh. But with adequate, and maybe even excessive, stocks of rice, wheat, cotton, edible oils and sugar, there is certainly no case for panic about the availability of these essential goods. The real reason for concern is different. This is that the authorities today appear to be significantly less concerned with the direct victims of drought, and that the system of contingency planning has been run down so much in the course of the liberalisation years that sheer incompetence in the management of what has actually been a rather minor drought episode during the current year has had to be played up as the worst in a century. It is this run-down management system and the supposed all-prevailing virtues of market forces which will really be on test if the weather gods are less favourable to the liberalisers than they have been so far.
© MACROSCAN 2000