Themes > Features
24.07.2001
Rural Employment in the 1990s
When
the first results of the 55th Round of the National Sample
Survey were released, it was already apparent that there had been some
major shifts in patterns of employment, especially in the rural areas. The
55th Round indicated a substantial decline in the share of
agriculture and a rise in the share of non-agriculture in employment. In
itself this could be a positive sign of progress and diversification, but
it was associated with a fairly large drop in work participation rates of
both men and women, which indicated a deceleration in aggregate employment
growth.
Such a deceleration has now been confirmed by the 2001 Census. When the estimated population is used to estimate the total number of those in some form of employment in 1999-2000, it yields results which show an even sharper drop in the rate of growth of rural employment generation than was previously supposed, although the fall in urban employment growth is less severe. This is shown in Chart 1, which show the annual rates of employment growth based on NSS and Census data combined, from 1983 onwards.
Chart 1 describes an average annual rate of growth of aggregate rural employment growth of only 0.58 per cent over the period between 1993-94 and 1999-2000. This makes it not only as low as around one-fourth of the previous period’s rate, but also the lowest such rate of increase observed since the NSS first began recording employment data in the 1950s.

However, despite what appears to be a very disturbing picture in terms of rural employment growth, there are those who have argued that the 55th Round data actually reflects many positive features and that the slowdown in employment growth is not really cause for concern. This argument is based on two points : the rise in the number of those in education, and the increase in non-agricultural employment.
Thus, it is argued that the fall in work participation for both males and females actually reflects a large increase in the number of those who would earlier have been in the work force and are now in full time education, especially in the age group 15 to 19 years. The increase in education is in any case a very welcome sign, and if it explained all of the decline in work force participation, then it would clearly be even more cause for celebration.
Similarly, non-agricultural work has increased not only relative to those in employment, but also as a proportion of population compared to the last large sample of the NSS in 1993-94. There has been an argument that such an increase generally reflects a process of diversification of employment which is a necessary and desirable feature of development, rather than a distress sign of inadequate employment generation within agriculture. There are others who have seen it as the result of public expenditure patterns which generate non-agricultural employment in particular periods. But of course interpreting this movement requires more analysis of the context in which it is occurring.
To understand how these features can be best be understood in the context of the 55th Round evidence, it is probably necessary to take a slightly longer term view as well as to examine the actual patterns in employment more closely. Chart 2 provides evidence on the type of employment (regular, casual or self employed) of rural males according to the various NSS Rounds since the 38th Round of 1983-84, while Chart 3 gives the same information for rural females.

For males, it is evident that the long term tendency for the gradual decline in self-employment and the increase in casual employment grew especially marked over the most recent period, that is the late 1990s. But self employment still dominates in the aggregate, accounting for around 55 per cent of total employment. Regular employment appears to have stabilised at a rather low proportion of the rural male workforce of around 7-8 per cent, after falling from around 9-10 per cent in the mid 1980s.
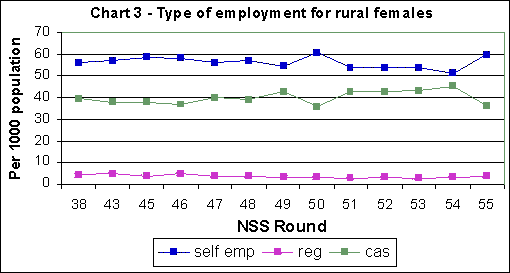
For rural females, the type of employment seems to fluctuate much more substantially, with no clear trend over the period as a whole. In the 1990s, there appears to have been an increase in self-employment. Of course, this may reflect factors such as greater recognition of women’s work within the household and the effect of probing questions and enhanced sensitivity among the enumerators. But it may also reflect the decline in casual work, as indicated by the chart.
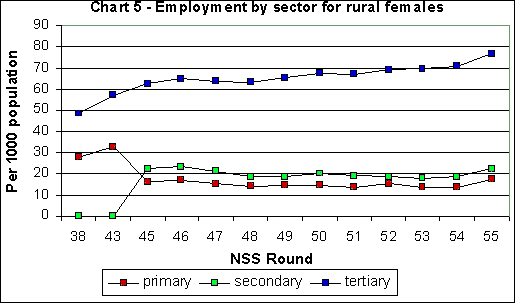
Charts 3 and 4 describe the sectoral composition of such employment for rural men and women as between primary, secondary and tertiary sectors. This is where the extent of employment diversification away from agriculture would be indicated. For rural males, there is evidence of a long term decline in the share of primary employment, but this is very gradual and the trend is not very clear. For almost the entire 1990s as well, the share of primary employment hovered at around 74-75 per cent of the total male employment, which is extremely high.
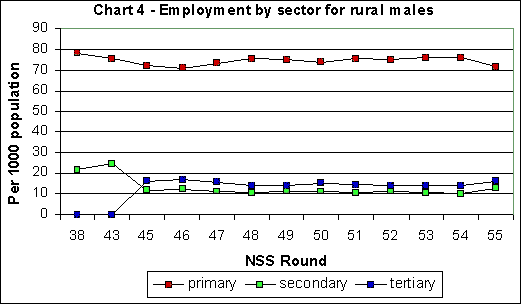
The 55th Round does show a fairly sharp drop in primary employment, but this is in marked contrast to all the previous Rounds of the 1990s, and therefore certainly deserves to be explored further. Also, even this is still around the levels observed in 1990 in the 46th Round. So, at first glance the data suggest that for rural male workers diversification away from primary employment had occurred, albeit slowly, in the period until 1990, that this process had been halted and even reversed over the 1990s, and that the change in 1999-2000 would indicate a recovery to the levels of one decade earlier. However, there is scope for more detailed analysis into this process.
For rural women workers, the tertiary sector has always dominated in employment, and the data indicate a marked process of increase in employment in this sector over the 1990s. However, primary sector employment, if anything, seems to have increased over the 1990s, and especially in the 55th Round.
An important methodological point should be made here. The data in Charts 2 to 5 refer to the broad definition of employment, which covers both “Principal Status” and “Subsidiary Status” activities, under the Usual Status criterion. The NSS classifies activities according to the major time or priority criterion. The activity on which a relatively longer time is spent is defined as the “Principal Status” activity, those in a which a relatively shorter time is spent is defined as a “Subsidiary” activity.
Subsidiary activities include a whole range of economic activities which may be extremely minor in terms of the actual time employed in them – for example, if a single cow is regularly milked every morning or if a chicken is fed daily by a member of the rural household, that could be included as a subsidiary activity under livestock rearing.
In a significant break from past Survey Rounds, the 55th Round enlarged the coverage of Subsidiary Status activities. In the questionnaire schedule, the past practice was to record the details for only one subsidiary usual economic activity of all the members of the household. However, in the 55th Round, two subsidiary usual economic activities pursued by members of the household for relatively more time were recorded.
While this would certainly add more valuable information about the nature of rural economic activity, it would also mean that more such activities would be covered than were covered earlier. This could lead to an impression of employment expansion and diversification which would appear to be more than in previous Rounds even if it simply reflected the greater recording of such activities. This could make the data from the 5th Round less comparable to that extent.
For this reason, the next set of charts provides data for different definitions of activity – for Principal and Subsidiary usual status taken together, for Principal usual status alone, and for weekly status. (The current weekly status is the activity status obtaining for a person during the period of 7 days before the date of the survey. It is decided on the basis of priority cum major time criterion.)
As far as male employment in agriculture and non-agriculture – shown in Charts 6 and 7 - is concerned, the pattern does not seem to vary much for the 55th Round compared to the other Rounds as far as the difference between Principal plus Subsidiary Status and Principal Status alone is considered. What is very interesting, however, is that while there is a substantial difference between Principal and Subsidiary Status together with Principal Status alone for agricultural work, with the latter being much lower than the former, there is very little difference according to the two definitions for non-agricultural work.
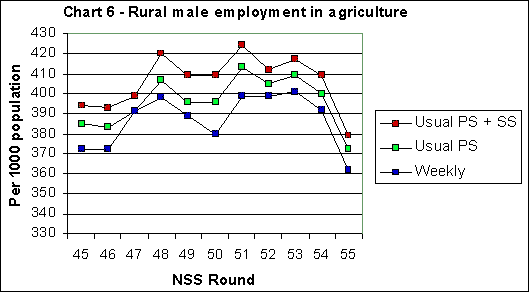
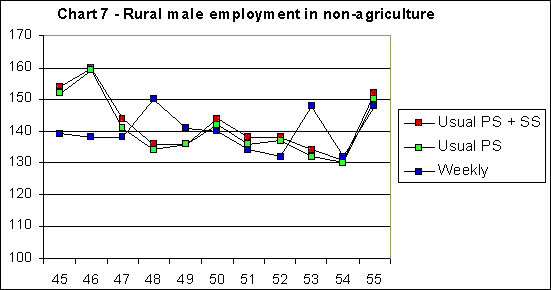
In other words, much of the subsidiary economic activity for rural males tends to be some form of agricultural activity rather than non-agricultural work. It is also worth noting that the current weekly status, which gives a flow measure of labour rather than a stock measure, provides much lower estimates of activity for agriculture in particular.
For rural women, the picture is quite different. To begin with, Chart 10 shows that the 55th Round stands out in terms of a very sharp drop in the share of agriculture, which is completely counter to the earlier rising trend evidenced from all the earlier Surveys of the 1990s. In fact, according to Principal and Subsidiary Status together, the drop in the share of agricultural work is around 12 percentage points, from 37.6 to 25.5 per cent just between 1998 and 1999-2000, which appears rather implausible.
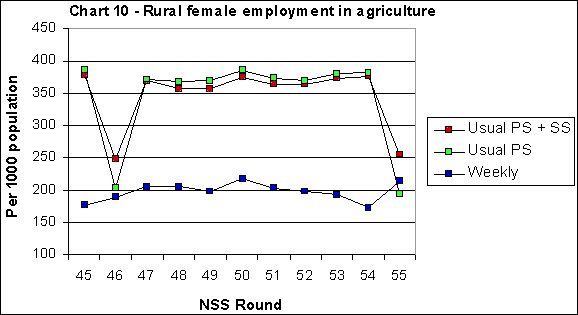
This decline is even sharper if the Principal status alone is considered, which fell by nearly 20 percentage points between the two Surveys which were very close together in time. Meanwhile, however, the weekly measure shows an increase in the share of agricultural work. All this clearly deserves more investigation.
The point is that such a dramatic decline does not appear to have been compensated for by a commensurate increase in non-agricultural employment for rural females. It is true that the 55th Round does indicate an increase in this share by all the indicators, but this still accounts in total for a very small share of less than 5 per cent of the total female population.
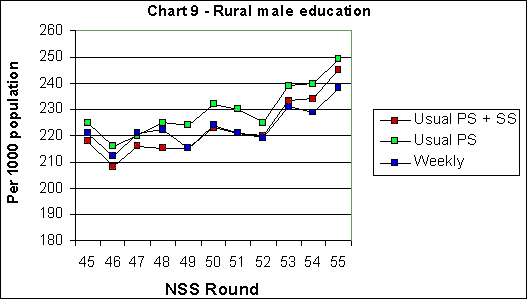
For both males and females, the overall decline in work participation which is reflected by these figures should be explained by either education or unemployment, or a combination of the two. As Chart 9 show, the proportion of males in education has indeed increased, but this increase is not as substantial as the fall in aggregate employment rates would lead us to expect. In fact the 55th Round shows very little difference from the earlier Rounds in this respect, merely conforming to the generally upward trend but with no sharp additional increase.
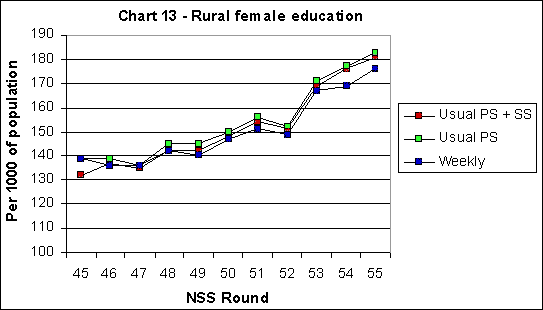
Similarly Chart 13 which shows the same data for rural females again shows that there is a continuation of the earlier upward trend in terms of participation in education, but the increase is not large enough to explain away the fall in aggregate employment rate (as per cent of population). It is also worth noting that for both males and females, the current weekly status shows a lower degree of participation in education than the usual status definitions, indicating that even when there may be formal registration in education, actual attendance is probably less. (The current daily status shows an even lower rate.)
So then what are the trends in unemployment ? Chart 8 plots the male unemployment rates as proportion of rural male population, while Chart 12 does the same for females. It is interesting to find that the usual status definitions actually suggest that unemployment rates fell in the 5th Round compared to the immediately preceding Round, although they remain higher than for the previous large sample survey. For women the unemployment rate even by usual status increased over previous Rounds.
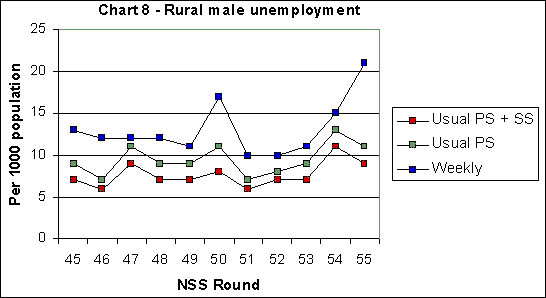
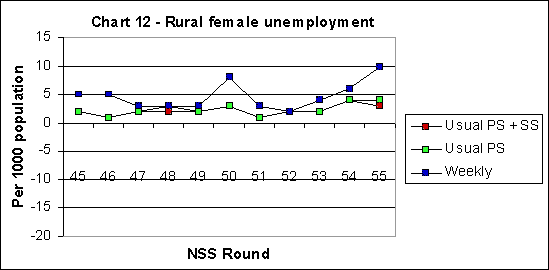
But even more striking than that is the strong divergence that the latest Round suggests between usual status and current weekly status definitions of unemployment. It should be noted that even the current weekly status definition of unemployment is a fairly restrictive one, which excludes large numbers of people who are effectively unemployed. Thus, the NSS reports a person as working if he or she had worked (i.e. pursued any economic activity) for at least one hour on at least one day during the 7 days preceding the date of survey.
Even by this very restrictive definition, the 55th Round results suggest that the proportion of male population who had not found any work for even an hour in the previous week had doubled to more than 2 per cent (amounting to a much higher share of the labour force) in just the period since the previous survey. For women too, the unemployment rate by weekly status definition shows a sharp increase.
More to the point, since the decline in work participation rates cannot be fully explained by either education or unemployment, it seems that there must be other factors which are affecting the rates. In developed countries, much is made of the "discouraged worker effect", which means that those who find it difficult to get jobs often withdraw from the labour force. This is likely to have much less relevance in the Indian rural economy context where informal and self-employment figure much more prominently, where social security systems are lacking and where the luxury of open unemployment is simply not available to most of the poor population.
In this context, the facts of decelerating employment growth, increased unemployment rates and declining work participation rates which cannot be explained completely by greater participation in education, point to a very serious crisis of employment generation in rural India. The aggregate picture, therefore, is one that must lead to pressure for reorienting the macroeconomic strategy towards the basic goal of increasing productive employment opportunity.
© MACROSCAN 2001