Themes > Features
20.02.2002
Could the World be in Depression Again ?
The talk of possible recession has been in
the air internationally for some time now. And of course, after the
September 11 attacks on New York and Washington, the US Government, the
IMF and others were quick to seize on this as the excuse for predicting a
future downturn, which could then be claimed as the adverse fallout of
international terrorism.
The truth is of course, that the weakness
in the international economy was already well advanced for some time
before September 2001. In fact, much of the world economy had actually
been experiencing a slowdown or recession for several years before the
last quarter of 2001.
In fact, the most striking feature of
international economic trends during the 1990s was that the US experienced
strong growth while most of the other economies in the world system
languished. This was essentially because confidence in the US dollar had
made American capital markets a haven for the financial investors. This
fed a consumption-led boom within the US, and also caused growing current
balance of payments deficits for the US economy. The current account
deficit of the US reached the record level of $ 450 billion by the end of
2001.
These
trends made the latter half of the 1990s unique in the history of post-war
capitalism or another reason. In the past the country holding the
international reserve currency did not face any national budget constraint
because it could print money and spend it across the world, since everyone
was willing to accept and hold such money. As a result, the government of
that country routinely resorted to deficit spending to keep the world
economy moving. That is, the US economy played the role of locomotive of
world growth by sustaining deficit-financed spending.
According to one estimate (published by
Morgan Stanley) the growth in US gross domestic product was responsible
for about 40 percent of the cumulative increase in world GDP in the five
years ending in mid-2000, which is twice America’s share of the global
economy. In this period, demand growth in the US was 4.9 per cent per
annum compared to 1.8 per cent in the rest of the world. In other words,
US economic expansion pulled the rest of the world behind it, at least to
some extent.
That process ended some time in late 2000.
And with the US engine of growth slowing down, it meant that other
countries - which had been relying on the huge demand for their exports
from the US to keep their own growth rates positive - were adversely
affected. This has been immediately evident in terms of world trade. WTO
figures suggest that the growth of world trade in volume terms, which was
more than 12 per cent in 2000, was only around 2 per cent in 2001. And
when this is combined with continued deflation in terms of trading prices
in world markets for primary commodities and many manufactured goods,
world trade in value terms was stagnant.
Patterns of output growth and prices in the
major economies
The growth patterns in the major developed
industrial countries are crucial indicators of the overall pattern of the
international economy. Chart 1 provides the IMF’s latest estimates and
projections of growth of real GDP. It should be noted that these
estimates, published in December 2001, are already significantly lower
than those published by the IMF just three months earlier. While the IMF
has attributed the decline to the September terrorist attacks, it could be
argued that the earlier estimates were anyway to optimistic, as many had
suggested at the time.

Thus the United States economy, which had
led in terms of growth rates of more than 4 per cent per annum until 2000,
fell to only 1 per cent growth of real GDP in 2001. In fact, other sources
suggest even lower growth figures for the US for the past year.
Industrial output in particular has been falling for more than a year.
Further, this period of slowing growth has
been accompanied by decelerating and now even declining price levels,
raising a real threat of deflation for the first time since the Great
Depression. Chart 2 gives the IMF estimates of changes in consumer prices,
which suggest that inflation slowed down sharply and there was deflation
in Japan. But other sources point to stronger tendencies towards deflation
even in the US economy. Figures from the US Labour Department indicate
that while wholesale prices rose by 0.1 per cent in January 2002, they had
fallen a cumulative 2.6 per cent in the year to January, which was in fact
the biggest 12-month drop in half a century.

Similarly, the data on industrial capacity,
(only 75 per cent in January 2002) a quarter of which went unused in
January have been argued to reflect strong productivity growth, but they
also raise concerns about the risk of deflation - a vicious cycle of
falling prices, profits, production and employment. Business investment in
the US fell by nearly 13 per cent in the last quarter of 2001 compared to
the previous year, making it the fourth consecutive quarter of falling
investment.
The European Union was supposed to be
recovering from 2000, but the past year’s growth performance was once
again lower, suggesting that the earlier growth impetus, such as it was,
was not sufficient to raise the dynamism in the European economy. Both the
IMF and the OECD estimates suggest a further deterioration in aggregate
growth performance of the European Union in the coming year.
The Japanese economy is currently in the
weakest position of all the major capitalist economies. Clearly this
economy is in the grip of a classic deflation, with low output, falling
prices and poor expectations leading to declining levels of investment.
The Japanese government’s own forecasts show that the economy will not
grow at all in the fiscal year starting in April, with unemployment
continuing to rise, to nearly 6 per cent.
In 2001, prices in Japan fell for the third year in a row, which is
unprecedented for a major industrial economy since the 1930s. Furthermore,
net export performance has also worsened. There was a 38 per cent fall in
the Japanese trade surplus for 2001, the largest fall since 1970 and the
third successive year of decline.
Accompanying all this has been a strange
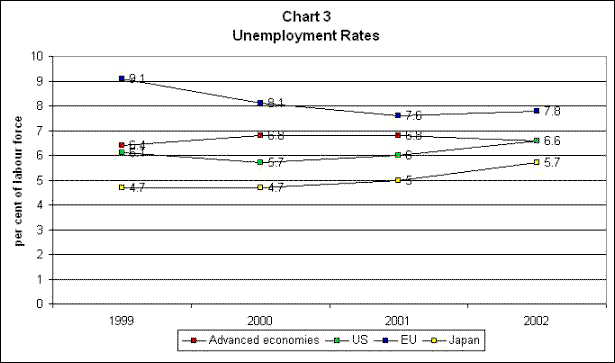
process of convergence of unemployment rates, as evident from Chart 3.
While Japan had always been considered a low unemployment economy largely
for structural reasons, it was argued that more “flexible” labour market
combined with greater economic dynamism made rates of open unemployment
much lower in the US than in Western Europe. But Chart 3 shows that over
the recent past, while rates of unemployment have been declining in Europe
(despite less impressive output growth) they have been rising in both the
US and Japan.
What is the prognosis, given such a
combination of forces in the major economies ? Most analysts have been
pessimistic about the prospects of an early recovery, despite the Bush
administration’s efforts to provide a fiscal stimulus through large tax
cuts and increased spending, especially after September 11. The pessimism
ranges from perceptions that the size of the fiscal stimulus is simply not
enough to provide the kind of stimulus which is required, to the argument
that it has been largely oriented towards tax cuts for large corporations
and the wealthy along with increased military spending, neither of which
have large multiplier effects.
Another view is expressed in a report
issued in December 2001 by the Levy Economics Institute, written by
economists Wynne Godley and Alex Izurieta. This argued that the current
recession in the US is different from earlier recessions because of large
structural imbalances in the US economy. According to them, “the United
States should now be prepared for one of the deepest and most intractable
recessions of the post-World War II period, with no natural process of
recovery in sight unless a large and complex orientation of policy occurs
both here and in the rest of the world. The grounds for reaching this
sombre conclusion are that very large structural imbalances, with unique
characteristics, have been allowed to develop. These imbalances were
always bound to unravel, and it now looks as though the unraveling is well
under way.”
In Japan, deflation currently poses the
greatest threat. Not only have prices been falling over the past three
years, the rate of decline has been accelerating. Falling prices raise the
real level of interest, which explains why the very loose monetary policy
with historically low nominal interest rates has not implied falling real
rates of interest, This is the classic “liquidity trap” situation. High
real rates of interest in a depressed real economy increase the debt
burden on both the private and public sectors to potentially unsustainable
levels. Over the past decade, the ratio of gross public debt to GDP in
Japan has increased from 61 percent to 131 percent, which is now the
highest level for any OECD country. If debt levels keep rising in this
manner, it is possible that this may lead to a collapse in public
confidence in such debt, which in turn can even lead to an Argentina-like
crisis with soaring interest rates, high inflation and outright default.
This means that the attempt to explain the
Japanese economic conundrum in terms of a bloated and opaque banking
sector completely misses the point, since it is the macroeconomic
conditions which are creating the problems in individual banks as well.
Certainly it is the case that in an economy that is already burdened with
vast post-bubble debt and a heavy burden of non-performing loans held by
the banking system, falling prices and consequently rising real interest
rates could result in a spiral of mass bankruptcy, financial contraction
and deepening recession.
So far the rest of the developed world has
tried to ignore the magnitude of the Japanese economic quagmire, and
certainly has not provided any meaningful assistance. But there can be
significant international implications if the problems get worse, which
they seem likely to do at present. Japanese capital has financed a large
portion of the US international debt. So an implosion on the Tokyo
financial markets, leading to the calling in of funds from the rest of the
world, would have major consequences for the world economy. At the very
least this would certainly prevent a rapid recovery in US financial
markets, but it could have even more devastating financial effects.
Policy choices : The fiscal stance
One of the more destructive economic
consequences of the downfall of Keynesianism in mainstream policy
discussion has been the conscious rejection of the fiscal stance as a
major means of changing levels of economic activity. One of the more
blatant examples of this has been in the case of the European Union, in
which the Growth and Stability Pact of the Maastricht Agreement explicitly
restricted the ability of member states to use fiscal deficits to reduce
levels of excess capacity and unemployment.
Nevertheless it is true that the conditions
for using fiscal policy in this manner have changed significantly over the
past decade, partly because of the cross-border mobility of finance, which
can play havoc with domestic attempts to reflate economies, and partly
because of certain other processes. In fact, what is remarkable about the
period since the mid-1990s in particular, is the very different effects
that fiscal policy have had on particular economies, often completely
contrary to received wisdom.
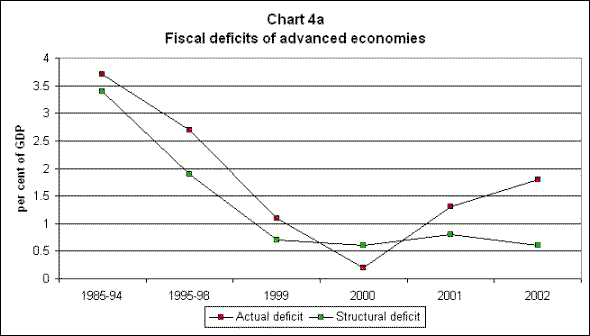
Consider the evidence presented in Charts
4a to 4d. The first point to not is how the fiscal deficits have been
declining quite rapidly as shares of GDP in all the advanced countries
taken as a group, to very low levels. In fact, in terms of structural
deficit (that is, accounting for the fact that fiscal deficits move with
business cycles, increasing in slumps and declining in booms), the fiscal
deficit in the major advanced economies was less than 2 per cent of GDP in
the latter half of the 1990s and has been less than 1 per cent thereafter.
In the United States, the boom was originally led by
large increases in government spending combined with tax cuts. In the mid-1990s, however, the
US, despite being the country with the international
reserve currency, chose to curtail its fiscal deficits initially. And when
the US government was confronted with surpluses in the course of the boom
triggered by private spending, it chose to hand over some part of those
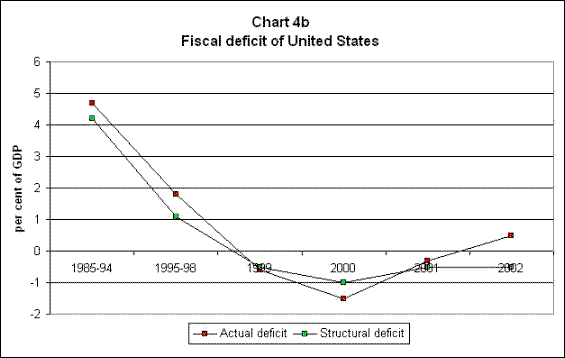
surpluses to the private sector in the form of tax cuts. As Chart 4b
shows, since 1999 the US government budget has been in surplus (negative
deficit indicates surplus).
Nevertheless, the US economy continued to surge ahead in
growth terms over this period. The demand increase was therefore entirely
private sector-led, fuelled by debt-driven household consumption increases
which were inspired by the capital gains made by those with some direct or
indirect investment in stocks and shares. Since the middle of 2000,
however, such capital gains have turned negative.
However, fiscal policy has responded by becoming more
expansionary only in the very recent past, with expenditure increases of
just under $100 billion being announced in the wake of the terror and
anthrax attacks. Instead, over most of 2001, official policy has been
directed towards a looser monetary policy, with the US Federal Reserve
announcing six interest rate cuts over the course of the year. However the
interest rate cuts alone have done very little to push the economy out of
the current recession.
In Europe, the attempts at fiscal compression seem to have
gone much further than even the fairly stringent requirements of the
Stability and Growth Pact. Both the actual and structural fiscal deficits
(shown in Chart 4c) since 1998 have been amazingly low, well below 1.5 per
cent of GDP, despite the evident recession and the continuing high level
of unemployment. Given the supposed political domination of Social
Democratic parties in most of the government of Euro area countries, this
pattern obviously requires greater political economy analysis.

But the most striking pattern is that of the Japanese
economy (Chart 4d), in which the fiscal stimulus appears to have been used
with much effort but to little effect over the past few years. The
Japanese government budget has moved from the modest surpluses which
characterised the decade until 1985, to very large deficits amounting in
some years to nearly 8 per cent of GDP. These were part of the efforts to
pump-prime the system, along with low nominal interest rates that have
reached near-zero levels. But still they have not been able to lift the
Japanese economy out of the deflationary spiral.

What do these contrasting fiscal patterns and their even
more contrasting results suggest ? It would be wrong to infer from these
that fiscal policy is not an important means of changing levels of
economic activity in the advanced capitalist economies. However, these
data do suggest that the pattern of fiscal stance, of the kind of spending
and taxation decisions that are made, may be even more significant than
the absolute levels. Crucially, they are important because they can change
levels of employment, and these in turn play an important role in
affecting expectations of economic agents in the economy.
Thus, in the US economy, the fiscal stance could be low
because the consumption boom was associated with employment growth which
in turn added to higher private spending. Conversely, in Japan the
combination of fiscal stimulus and interest rate cuts was not sufficient
to reverse the trend of declining employment opportunities. These led to
depressed expectations, which in turn meant that additional incomes tended
to be saved to insure against future job loss, and therefore did not
translate into higher economic activity.
The role of unemployment and employment growth
Clearly, therefore, it is necessary to investigate patterns
of employment and unemployment in the major advanced economies more
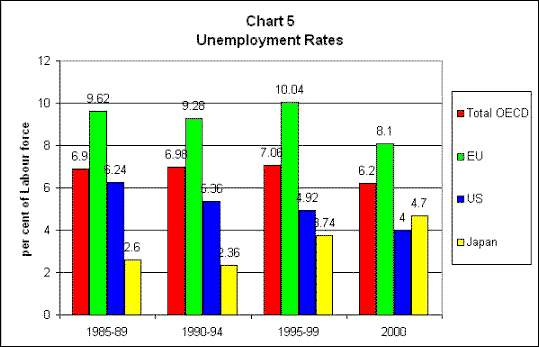
closely. Chart 5 show the unemployment rates (as per cent of labour force)
in the OECD economies, and shows how in all the major countries except US,
unemployment rates have tended to increase over the latter part of the
1990s.
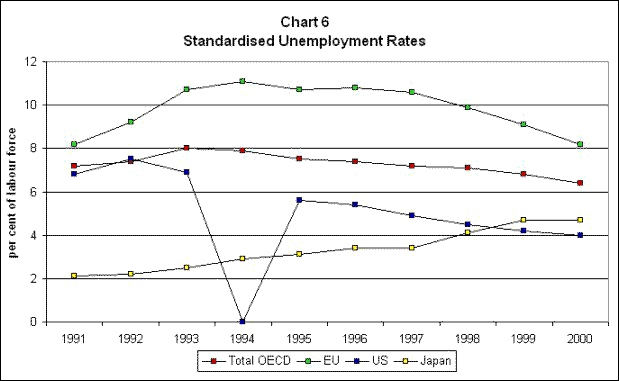
However, there are substantial differences in definition
and measurement of open unemployment across the OECD, and therefore Chart
6 presents the standardised data which tries to use similar definitions.
This presents a rather different picture. Thus, Japanese unemployment
rates appear to rise more sharply while European unemployment rates appear
to have fallen slightly.
A major problem with such data is the growing presence of
the “discouraged worker effect”, whereby potential workers and long term
unemployed (especially but not exclusively women) tend to drop out of the
labour force and therefore disappear from both numerator and denominator.
This problem has been evident in Europe for some time, but there are
indications that it has been growing in the US as well in recent times.
Thus the slight fall in the unemployment rate in January 2002 from 5.8 per
cent to 5.6 per cent, has been widely attributed to the “discouraged
worker effect”.
Because of this, rates of aggregate employment growth may
be a slightly better indicator of labour market conditions than open
unemployment rates. Of course, even these do not give us an idea of the
nature and quality of employment, as most governments increasingly include
a range of part-time and casual employment as well, which may reflect
distressed worker involvement. Nevertheless, Chart 7 presents the evidence
on rates of employment growth in the major OECD countries.
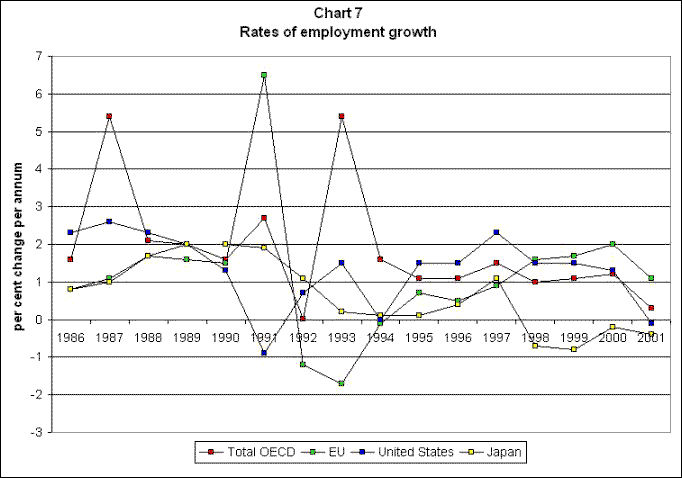
The picture that emerges is that of fluctuating rates of
expansion, but overall a fairly dismal performance. The other point to
note is that the employment expansion of the US economy is not all that
impressive in comparative perspective, and has been less than 2 per cent
per annum over the past five years on average.
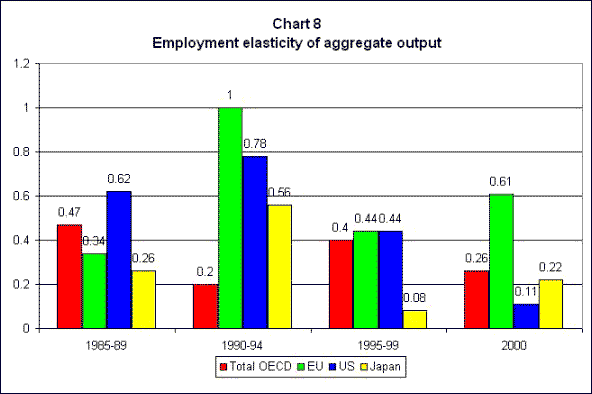
This is confirmed by the rather rough estimates of
employment elasticity of aggregate output (per cent change in employment
by per cent change in real output) that are provided in Chart 8. Once
again, after the early 1990s, the US economy does not emerge as
considerably more dynamic than other OECD countries in terms of generating
more employment. (It should be noted, however, that the figure of 1 for
the European Union for the period 1990-94 is misleading, for it refers to
a period when both output and employment growth were mildly negative.) In
fact, in recent years the employment elasticity of output growth in the US
economy appears to have been very low.
This points to a major structural weakness of the past
growth pattern, which is likely to have important effects on the prospects
for early recovery in the developed world. As long as basic employment
conditions do not improve, attempts to generate economic expansion by
encouraging private savings and investment – such as in the form of tax
cuts and easy money through low interest rates - are likely to falter.
This is because those in employment are likely to guard against the
possibility of future job loss by saving more rather than spending more.
To counter such a tendency, fiscal packages have to be not only very large
but also explicitly directed at job creation. This has not been the case
so far in either US or Japan, while in Europe the fiscal stimulus has in
any case been weak.
In addition to this, there are other reasons why it may be
futile to expect another US-led boom to bring about a recovery in the
world economy once again. After all, the current recession in the US
reflects the collapse of a speculative bubble, and it would be strange if
the economy could immediately create another such bubble to generate that
kind of economic growth.
At present, the bursting of the bubble involves the
corporate sector cutting back investment because of overcapacity and the
household sector reducing its consumption because it is already financed
by record levels of private debt. A rapid reversal of these tendencies is
not only unlikely, but it would also require additional international
financing, with the rest of the world’s savings once again rushing in to
maintain high levels of US consumption and economic activity.
An increase in US growth levels sufficient
to lift the world economy would lead to a further rapid widening of the US
balance of payments deficit, which is already at more than 4.5 percent of
GDP. Such a payments gap would in turn require an increased financial
inflow from the rest of the world to sustain it. But the rest of the world
already provides nearly $2 billion per day in their savings to the US
economy. It is difficult to see how this can be increased in a wider
international context of lower income growth and stagnant employment
generation.
Clearly, the only feasible solution for
international capitalism is concerted expansion, directed by a responsible
world “leader” who would behave in a Kindleberger fashion to organise such
an expansion. But the current international political economy suggests
that such a solution is not feasible or likely at the moment. Therefore,
some sort of world depression does indeed seem likely.
© MACROSCAN 2002