Themes > Features
22.04.2003
Why is Agricultural Employment Generation Falling?
Although employment in general has been a major failure of the
macroeconomic policies of the past decade, the decline in employment
generation in agriculture is probably more startling. The Census of
India 2001 and the 55th Round of the NSS, both show a
dramatic slowdown (and in some states, actual decline) of employment in
agriculture.
The NSS data suggest that the employment elasticity of agricultural
output (the rate of change of employment per unit change of GDP in
agriculture) has fallen from 0.7 in the period 1987–88 to 1993–94, to
only 0.1 in the period 1993–94 to 1999–2000. This sharp fall means that
the employment elasticity is among the lowest yet observed in Indian
agriculture since such data began to be collected.
Chart 1 gives some indication of the evidence from the NSS. Employment
growth rates are provided for the periods 1987–88 to 1993–94 (hereafter
the first period) and 1993–94 to 1999–2000 (hereafter the second
period), using the 56th Round survey results according to
various definitions and superimposing them on Census population figures.
Note that these reflect people employed rather than actual work, since
there is no real estimate of days/hours worked.

The chart shows a very substantial decline of employment by all
indicators, to rates that are far below those of growth of population
over these periods. The usual status definition, which refers to what a
person usually does over the year in question, can be interpreted as a
stock measure of employment. Both in terms of principal activity and
principal plus subsidiary activities, there is evidence of very
significant falls in employment growth.
But there are even sharper falls, by the 'flows' definitions, of weekly
and daily status employment growth, suggesting that even for those who
saw themselves as usually employed, there were difficulties in getting
jobs on a weekly or daily basis.
Furthermore, the data indicate that the sharpest fall has been in the
number of those classified as 'self-employed' in agriculture, which has
actually exhibited an absolute overall decline. This means that the
number of persons working on household-operated holdings has gone down.
What explains this sharp fall in agricultural employment growth? A wide
range of explanations and associated interpretations have been offered.
A common explanation hinges on the expansion of the non-agricultural
sector in rural areas. According to this argument, labour has been
moving out of agriculture in the standard way predicted by the Lewis
model, without affecting productivity in agriculture because of the
prevalence of disguised unemployment in agriculture. This means that the
tendency is a wholly positive one, reflecting acceleration of growth and
development.
The problem with this argument is that while non-agricultural employment
has indeed increased as a share of population, the increase is nowhere
near enough to explain the dramatic decline in agricultural employment
generation. In fact, both the increasing role of education for the
younger age cohort and the apparent increase in non-agricultural
employment growth, are inadequate to counterbalance the sharply
decelerating growth in agricultural employment.
So much so that not all the increase in such employment may be the
result of positive pull factors. Rather, several observers have
described at least some of the increased non-agricultural employment as
possibly reflecting a distress phenomenon (or 'push' process), with
rural residents desperately searching for any jobs that are available or
whatever can be described as work.
Another explanation has to do with changes in technological and cropping
patterns that have reduced labour demand in agriculture. These factors
may certainly have played an important role. Much of the more recent
technological change in Indian agriculture has taken the form of
mechanization that is labour-saving. Indeed, the rate of labour-saving
mechanization appears to have increased over the past decade, and this
has both reduced labour demand and made smaller farmers relatively worse
off.
Similarly, cropping-pattern changes are also likely to have played a
role because even while they can have divergent effects, the general
thrust of such shifts (especially towards horticulture and floriculture
at the margin in some areas) may be said to have reduced demand for
labour.
An additional, and important, reason for the slowdown in employment
generation and the large fall in employment elasticity of agricultural
output growth may have to do with the pattern of land relations in rural
India. It is now clear that this period witnessed a significant degree
of concentration in terms of operated holdings, which reflected changes
in both ownership and tenancy patterns. Many small and very marginal
peasants lost their land during this period, and have therefore been
forced to look for work as landless labourers; micro-level surveys have
reported increasing leasing-in by large farmers from small landowners.
This is indicated, on an all-India level, in Chart 2. There has been a
steep increase in landless households as a percentage of total rural
households, from around 35 per cent in 1987–88 to as much as 41 per cent
in 1999–2000.

It is well known that, for various reasons, persons occupying small
holdings tend to use land and labour more intensively than those with
larger farms, to achieve higher per land unit productivity. Typically,
this means that they employ more household members at least in some
agricultural work, whether it be principal or subsidiary activity. If
those who previously occupied land are now effectively dispossessed and
are forced to hire themselves out as wage labour, the chances are low of
a similar level of household employment being achieved.
In other words, when a particular plot of land is occupied by small and
marginal peasants working on household farms it is likely to show higher
use of labour than when the same plot is taken over by a large farmer
using hired labour. Not all of this may be disguised unemployment, since
the fact that small/marginal cultivators also use other non-land inputs
more intensively suggests that they would use this additional labour to
increase per hectare productivity.
Therefore, the phenomenon that is observed at the all-India level, of
increasing landlessness (even in terms of occupancy holdings) of the
rural population, may also lead to less employment generation in
agriculture.
In addition, households who operate less than 0.4 hectare of land can be
described as just below marginal, in that their holdings are unlikely to
provide subsistence for all the household members. This means that the
possibilities of employing all household members on that particular plot
of land are fewer, and they will be forced to seek outside employment.
This proportion is also indicated in Chart 1, where it is evident that
the total proportion of such households (landless plus marginal) by
1999–2000 was nearly two-thirds of the total number of rural households.
The question then remains, why has the proportion of landless population
increased so substantially over these two periods? This may actually be
a comment on the reduced viability of small farms, given the various
changes that have occurred in the countryside during this time.
One of the more crucial changes has been the virtual collapse of rural
credit in the organized sector, especially for small cultivators. The
reduced availability of credit, which has been documented, has very
severe implications for the functioning of small farms in particular. A
number of input costs have also increased, as fertilizer subsidies were
sought to be reduced and water rates and other user charges have gone
up.
In addition, there is some evidence that although real wage growth
slowed down substantially during the nineties, real wage rates continued
to increase in most parts of the country. Since the seasonality of
agricultural operations means that most cultivators, whatever the size
of holding, need to hire in some labour during the peak seasons, this
has the dual effect of increasing costs and raising the opportunity cost
of own cultivation.
The process of trade liberalization has meant that domestic agricultural
prices have less relation to domestic demand and supply conditions and
are more correlated with international price movements than before. This
means that even when the harvest is poor or when there is crop failure,
the cultivators do not get any recompense in terms of higher prices.
There is much greater use of a range of monetized inputs, including new
varieties of seed marketed by major multinational companies. Small
cultivators who take on debts (often from informal credit sources at
very high rates of interest) in order to pay for these cash inputs find
themselves in difficulty if for some reason there is crop failure or
output prices remain low.
All these could be why the proportion of rural households not operating
any land increased so much over this period. This in turn would mean
that are less people reporting themselves as self-employed in
agriculture (which is what is observed), and a general reduction in
employment generation because less people would be hired than had lost
employment from own cultivation.
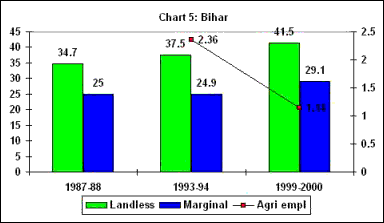
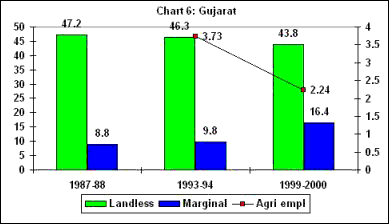
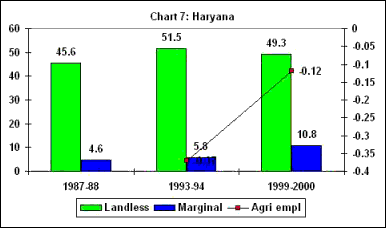
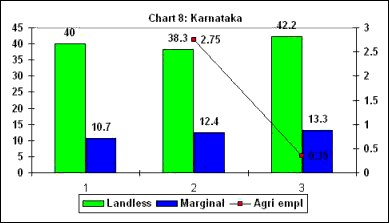
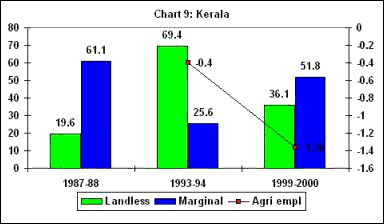
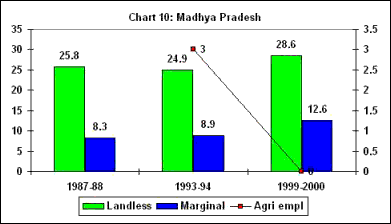
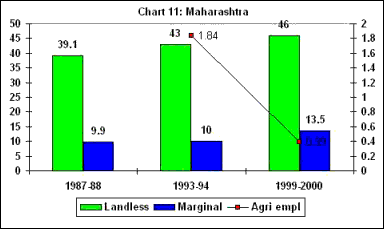
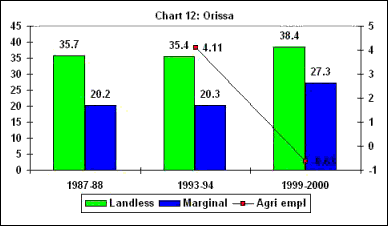
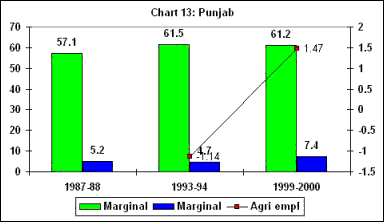
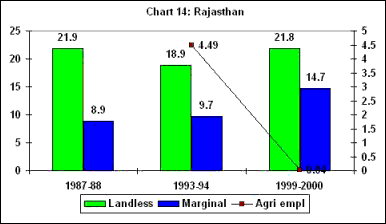
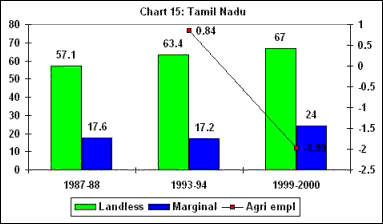
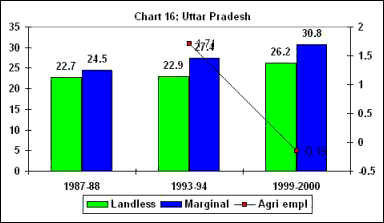
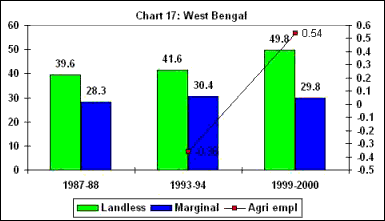
Is this aggregate pattern reflected across individual states? Charts 3
to 17 provide some indication of landholding changes (in terms of the
proportion of landless and marginal households to the total) along with
rates of growth of agricultural employment generation over these two
periods, in the major states.
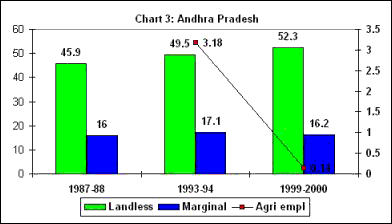
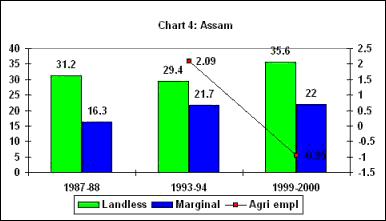
In these charts, the columns describe the
proportion of landless and marginal (that is, those operating holdings
less than 0.4 hectare) households in the years 1987–88, 1993–94 and
1999–2000. The line describes the growth of agricultural employment in
the first and second periods.
It is clear that the pattern of greater landlessness is common to all
the states. A significant majority of the states also show substantially
reduced agricultural employment growth. The extent of the deceleration
varies from state to state but it is usually quite sharp.
Only three states show the opposite tendency in terms of agricultural
employment-Haryana, Punjab and West Bengal. In the case of Haryana
(Chart 7), this is not of much significance because in both periods
agricultural employment growth was negative.
IIn Punjab (Chart 13), agricultural employment moves from a negative
rate of –1.14 per cent to a positive rate of 1.47 per cent, which is a
reasonably large shift and the opposite of what has occurred in most
other parts of the country. It should be noted, however, that in this
state the proportion of landless households remained broadly constant in
the latter period, suggesting that the role of changing land relations
was minimal.
West Bengal
(Chart 17) presents the most interesting case. Here, there has been a
significant increase in the landless population (up by 10 percentage
points of total households); yet, agricultural employment appears to
have accelerated over the latter period, going up from a negative rate
of –0.36 per cent to a positive rate of 0.54 per cent. This process
clearly deserves further examination. It is possible that
cropping-pattern changes have been such as to induce greater labour-use,
and there may have been other changes in the countryside which have
translated into greater availability of work in agriculture.
© MACROSCAN
2003