Themes > Features
15.05.2001
Economic Performance of the States in the 1990s
It is commonplace,
when talking about economic growth trends in the 1990s, to focus dominantly
on all-India data. However, there are very important regional differences,
not only in the per capita incomes of the different states, but in their
patterns of growth over time, and especially in the recent period. These
are important to examine periodically, not only because the regional
variations themselves may change over time, but because it turns out
that there are very quite standard misconceptions about relative performance
across different states. These misconceptions are typically fed by the
mainstream media, which has assumptions about which states are “good”
and “poor” performers in growth terms, which are either outdated
or else not borne out by actual experience. And since these misconceptions
rarely get tested against the available data, they assume the status
of stylised facts among the ordinary public.
Thus, for
example, there is a general perception, which has been heavily stressed
by the very successful media management of its Chief Minister, that
Andhra Pradesh is one of the most economically dynamic states, not just
in south India but among all the Indian states. By contrast, Kerala
is frequently described as a state which has very good human development
indicators but poor growth performance. Similarly, the state of West
Bengal is frequently described as being characterised by “economic
stagnation” by mainstream commentators.
How far
all of these perceptions are from the reality is evident from Tables
1 and 2, which describe the annual rates of growth of GDP at constant
(1993-94) prices over the period 1993-94 to 1998-99 for 14 major states.
(Rajasthan has been excluded because data are only available until 1997-98.)
These charts are based on national income accounts data released by
the CSO.

From Table 1 it is clear that Andhra Pradesh is one of the worst performers of all states in India in terms of aggregate economic growth over this period. Not only is the annual rate of growth well below that of the other southern states, but its rate of growth has been only marginally superior to the much-maligned “BIMARU” states of Bihar and Uttar Pradesh. In per capita terms the growth rate appears in a slightly better light, largely because of the slower rate of population growth over the period, but still is the worst among southern states.

Also, the
myth that the state of Kerala is a major laggard in terms of growth
also gets blown by the evidence. As Tables 1 and 2 show, Kerala is the
sixth most dynamic state in terms of aggregate state GDP growth, and
the fifth in terms of growth of per capita income. It is a comment on
the lack of knowledge of most analysts that the most common mainstream
discussion on Kerala’s economy is not on what have been the elements
and causes of such growth, but still on why the state has not grown
and has exhibited relative stagnation, even though that is not the actual
experience.
It is also
evident that West Bengal has exhibited much greater economic dynamism
than it has been given credit for. In fact, West Bengal shows up very
well in comparison to other states, with the fourth highest annual rate
of growth, after Gujarat, Karnataka and Tamil Nadu. Its growth performance
has been superior to that of states like Maharashtra, Punjab and Haryana
which are generally supposed to be high growth states.
And this
growth in West Bengal appears to have been evenly spread across the
different sectors. Thus, while certain service sectors such as communications
and trade have experienced double-digit annual rates of growth, even
the material producing sectors have performed very respectably, with
agriculture growing at 6 per cent per annum and manufacturing at 7 per
cent over this period.
However,
it is also true that some standard perceptions appear to be confirmed,
in terms of the low growth of states like Bihar, Orissa and Uttar Pradesh,
and the extremely poor economic growth in Assam. The most rapidly growing
states in economic terms over the period are Gujarat, Karnataka and
Tamil Nadu. However, Maharashtra, Haryana and Punjab, typically thought
of as high-growth states, do not appear to be so in relation to the
performance of other states.
Tables
3a-3d show the behaviour of constant price GDP (in index number terms)
of aggregate GDP over the period 1993-94 to 1998-99. While these broadly
confirm the picture provided by Table 1, they do bring out some other
interesting features. Thus, in Andhra Pradesh economic growth appear
to be not just on the low side but also more volatile than elsewhere.
Rajasthan, which is not covered in Chart 1, shows a surprisingly high
rate of economic expansion. The common impression that the southern
region economically outperforms the other regions is not borne out by
the evidence, which show some high growth and some low growth states
in all regions.


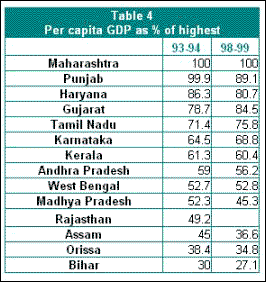
What all this means in terms of regional inequality is indicated in Table 4. While Maharashtra remains the richest state in terms of per capita income, the gap between it and other rich states has grown over the second part of the decade of the 1990s. The increase in the gap is particularly noticeable in the case of the second richest state, Punjab. Also, Gujarat has supplanted Haryana as the third richest in terms of per capita income. The poorest states of Assam, Orissa and Bihar, have actually experienced a relative worsening of their position, in terms of widening the gap between their per capita incomes and those of the richest state.

What explains
this very wide variation in growth experience across the states of India
? At one level, it appears that the overall growth process in the Indian
economy has widened income differentials not only across classes and
economic groups, but also across the regions. Thus, richer states such
as Gujarat, Karnataka and Tamil Nadu have also had among the highest
growth rates over the recent period. Meanwhile, as is clear from the
charts, the poorest states have also been the most laggard in terms
of economic performance.
If, despite
this, some of the relatively poorer states have managed to gain and
to grow at relatively faster rates, there would have been particular
specific factors at work, including the ability to the state government
to deal with the problem of inadequate local resources and low tax base.
Here it must be noted that among the poorer states (that is those with
a per capita GDP of less than 60 per cent of the richest state) only
West Bengal has shown a rate of growth that is significantly higher
than the national average and higher than that of most other states.
The other
poor states have exhibited low rates of growth as well. (Rajasthan,
for which data are available only till 1997-98, also shows a relatively
high rate of growth over that period.) This makes the performance of
West Bengal even more exceptional, and clearly it is something that
deserves further investigation as to the factors that have been associated
with it.
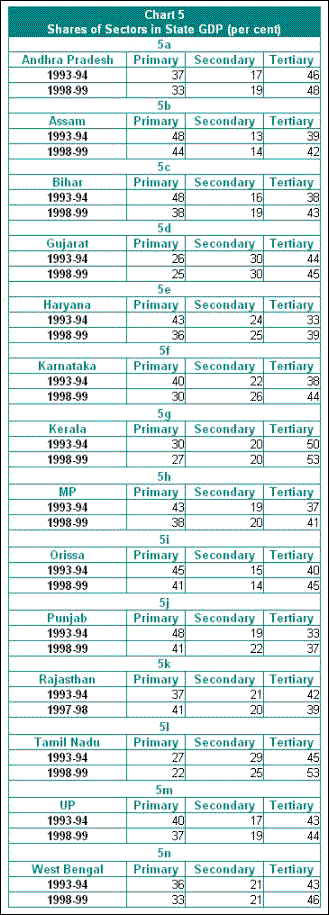
One point
is however clear for all the states. Only those states have shown relatively
good performance which have managed to achieve some degree of structural
change in terms of reducing the share of the primary sector in the economy.
Alternatively, they must have started the period with a relatively low
share of the primary sector. In particular, the high growth states show
shares of the secondary sector of 20 per cent or more, and this is something
which also typically increases over the period. By contrast, the low
growth states exhibit secondary sector shares of less than 20 per cent.
This is something that is clearly suggested by the different sub-tables
in Table 5.

While this
overall trend of differential performance and disparity in economic
growth patterns reflects a wide range of factors, many of which are
state-specific, it is also clear that overall macroeconomic policies
of the Central Government have contributed to this. Not only have they
tended to widen existing differentials, they have also not made any
obvious efforts to mitigate such tendencies through countervailing measures.
Thus, there has been no attempt to ensure that the poorest states are
able to grow at faster rates, either direct Central transfers or through
planned public investment which could have generated more such growth
directly and indirectly.
This means
that the poorer states are caught in a vicious circle : low aggregate
incomes means that the tax base is low and the concerned state government
finds it difficult to raise resources. This in turn means that public
expenditure is limited. This also curtails public investment which could
have generated more private investment as well through demand linkages.
Further, it keeps infrastructure development woefully inadequate, which
creates further supply constraints on growth.
In a sense
only a substantive regionally redistributive policy of the Central Government
can break this vicious cycle. Market functioning tends to aggravate
the problem because it directs private investment to those regions with
the higher purchasing power, that is the already richer regions, and
does not of its own provide either resources or increased productive
assets to the underdeveloped regions. Therefore, the effective disappearance
of the planning mechanism and the much greater reliance on market mechanisms
would have added to the tendencies for greater regional inequality.
Further,
greater public investment, especially on infrastructure is essential
to reduce the gap between states and bring the poorer states put of
backwardness. But the 1990s have witnessed a substantial decline in
such public capital expenditure, to less than 2 per cent of GDP in the
late 1990s, and even this pitiful amount has not been distributed across
states in a manner which would reduce the existing inequalities. All
this means that the persistence - and even accentuation - of regional
inequality, must be counted as one of the important failures of the
aggregate economic reform strategy of the 1990s.
This problem
can be addressed not only through purposive public investment and expenditure
which is designed to create and maintain much-needed infrastructure
in the backward states, but also through fiscal transfers. Indeed, the
successive Finance Commissions which decide on the formula or revenue
sharing between the Central Government and the State Governments are
meant to focus particularly on this issue.
Unfortunately,
even here the strategy of successive Central Governments in the 1990s
has been to reduce the amount of resources garnered which must necessarily
be transferred to the states. This has been accomplished through various
devices such as imposing surcharges on income tax (which need not be
shared) rather than raising the basic rates. Further, the loss of revenue
through a range of indirect taxes such as customs duties and the associated
need to reduce domestic excise duties has also operated to reduce the
share of taxes in GDP, which in turn affects the states.
This has
further reduced the manoeuvrability of those state governments which
cannot raise much resources through taxation. And the tendency of Central
Governments to treat any transfers as political largesse being offered
to the party in power at the state level, rather than as a developmental
requirement, has reinforced the tendencies towards inequality.
Thus, a
disaggregated look a the states’ economic performance indicates
that actual relative growth has been quite different from the picture
that is often presented in the media. All in all, it appears that the
uneven development of states is something that has been accentuated
over the 1990s, and this reflects the effect of the macroeconomic policies
of the Central Government as well.
© MACROSCAN 2001