Since
the release of the Key Indicators from the National
Sample Survey Organisation's (NSSO's) employment survey
relating to 2009-10, attention has been focused on
just a few features of those estimates. The most important
among them noted and discussed in the previous article
(''The Latest Employment Trends from the NSSO'') under
Features of Macroscan, is the significant deceleration
of the rate of growth of aggregate employment.
However,
government spokespersons have been quick to play down
the significance of those numbers by referring to
two other aspects of the NSS 2009-10 figures. The
first is the fact that part of the deceleration in
workforce expansion is the result of the substantially
larger number of young people opting to educate themselves.
If we focus on the 15-24 age group, which is the one
that is most likely to choose between education and
work, we find that the increase in the number of those
reporting themselves as occupied with obtaining an
education was much higher over the five years ending
2009-10 (16.7 million in the case of males and 11.9
million in the case of females) than was true over
the previous five years (5.6 and 5.2 million respectively).
This huge difference, which is a positive development
from the point of view of generating a better and
more skilled workforce, would have substantially reduced
the number entering the labour force, contributing
to the deceleration in the growth of the total number
of workers.
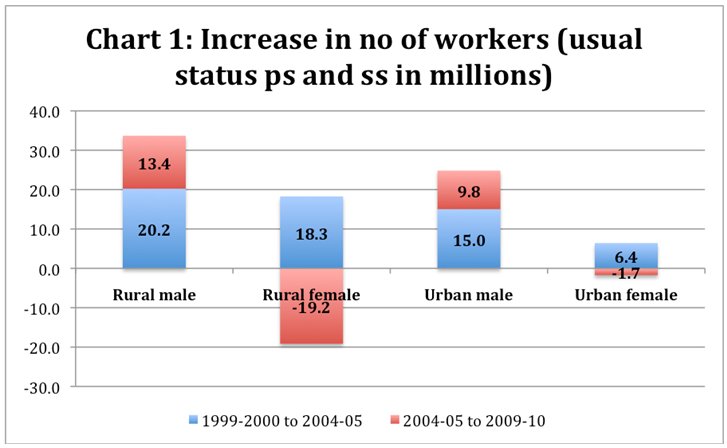
However, the aggregate numbers of principal and subsidiary
status workers suggest that this alone would be inadequate
to provide a satisfactory explanation of what seems
to be a dramatic collapse of employment. The total
number of usual status (principal and subsidiary)
workers, which increased by 60 million during the
five years ending 2004-05, rose by just 2.3 million
over the subsequent five years (Chart 1). (If we restrict
the comparison to just changes in principal status
workers the difference is still substantial though
less dramatic, standing at 48.3 and 13.1 million respectively).
This too has been discounted by pointing to the fact
that the fall in employment increments over the two
periods under comparison has been substantially due
to a fall in female employment. Rural female employment,
which rose by 18.3 million between 1999-2000 and 2004-05,
registered a decline of 19.2 million during 2004-05
and 2009-10. Even in the urban areas, the figures
for changes in female employment during the two periods
were significantly different at a positive 6.4 million
and a negative 1.7 million respectively. This has
been cited as evidence of a definite underestimation
of female employment.
Chart
1 >> Click
to Enlarge
The figures have provided the basis for the criticism
from within the government that the NSSO's 2009-10
survey has significantly underestimated female employment,
which is difficult to capture, especially in rural
areas. It is difficult indeed to believe that this
deficiency affected only the 2009-10 survey, especially
to the extent needed to explain the dramatic difference
in changes.
Moreover, if we stick to usual status (principal and
subsidiary status) employment, the change in male
employment also points to significant deceleration.
Between 1999-2000 and 2004-05 male employment increased
by 20.2 million in rural areas, while between 2004-05
and 2009-10 it rose by only 13.4 million. The corresponding
figures for the urban areas were 15 million and 9.8
million respectively. In the case of only principal
status workers, the increases had fallen from 19.2
to 13.6 million in rural areas and from 14.4 to 10.3
million in urban areas.
As noted earlier, this decline in employment is partly
explained by the sharp increase in those pursuing
an education in the 15-24 age group. We, therefore,
turn to an examination of the trends in employment
in the two main working age groups: 15-24 and 25-59.
Let us initially restrict the analysis to trends in
usual principal status employment for males, to accommodate
for what may be the partially correct criticism that
female employment was underestimated to a greater
degree in 2009-10 than before.
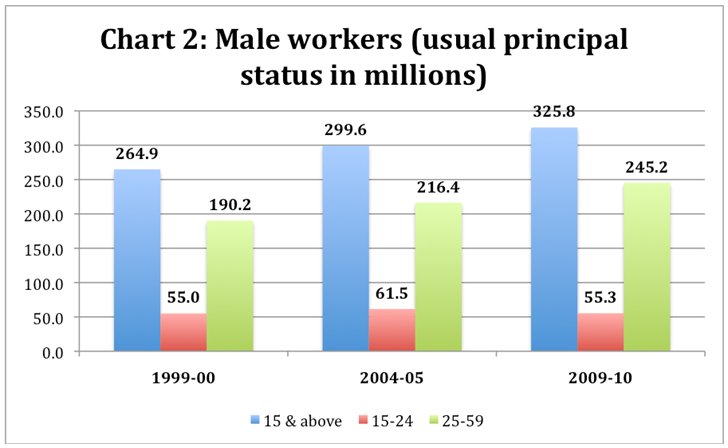
One positive signal here is that male employment in
the 25-59 age group rose when that in the (education-opting)
15 to 24 age group fell. Male employment (rural and
urban) in the 15-24 age group fell by 6.2 million
between 2004-05 and 2009-10 as compared to an increase
of 6.5 million during 1999-2000 and 2004-05. Contrary
to this, the figures for the changes in the 25-59
age group were 28.8 and 26.2 million respectively
(Chart 2). That is, there was a larger absolute increase
in 25-59 age group employment in the more recent period
when compared with the previous one. However, the
difference here too is small and the rate is marginally
lower (13.3 as opposed to 13.8 per cent) given the
rising base value.
In the case of females, however, even in this age
group employment fell during the recent period by
5.1 million, while it had increased by a huge 13.1
million during the previous period. Thus, even if
we restrict ourselves to the most favourable category
in aggregate principal status employment in the case
of males, which is the 25-59 age group, the most we
can say is that employment growth has not been lower
during the five years ending 2009-10, as compared
to the previous period. This is despite the fact that
these were the years when there was a substantial
acceleration of GDP growth from the 6-7 per cent range
to the 8-9 per cent range between these two periods.
Chart
2 >> Click
to Enlarge
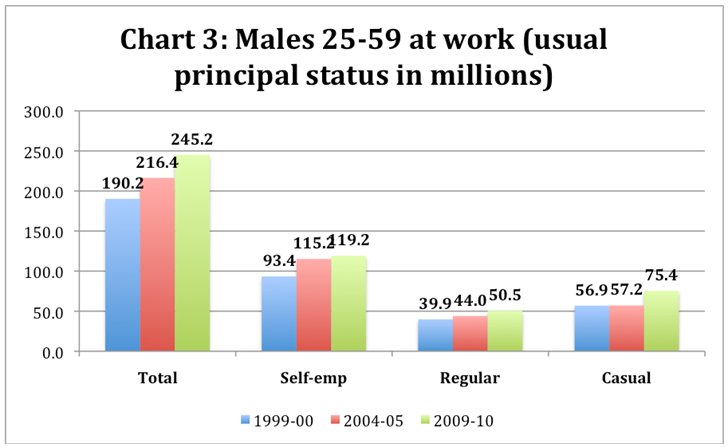
There
seems to be a second positive that emerges on first
examination of the data relating to male, 25-59 age
group employment, which is that much of the increase
in employment is paid employment as opposed to self-employment.
This points to a structural shift in employment generation
since most of the additional male employment generated
in this age group during the 1999-2000 to 2004-05
period was in the self-employment category (Chart
3).
Self-employment rose by 21.8 million during that period,
as compared with just 4 million during the more recent
period. On the other hand, during 2004-05 to 2009-10,
paid (regular or casual) employment increased by 24.6
million, as compared with just 4.4 million during
the previous period. Given the fact that self-employment
could be substantially distress-driven, this is indeed
welcome.
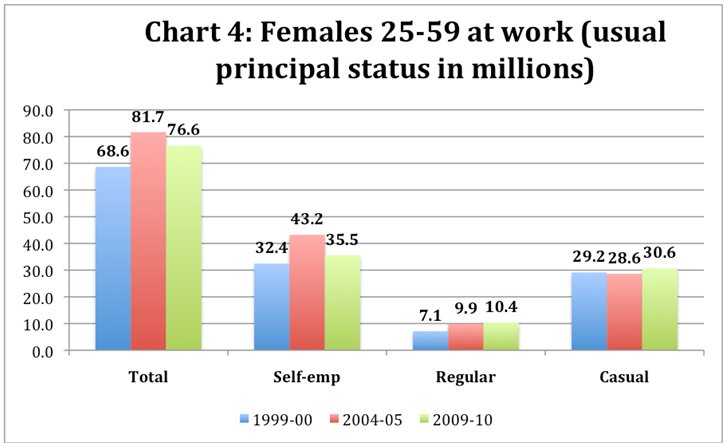
But that assessment needs to be moderated on three
counts. First, the structural shift in the nature
of additional employment occurs in a period when aggregate
employment even among 25-59 years-old males has not
been rising any faster. Second, around two-thirds
of the increase in paid employment in the recent period
is in the casual work category, which is likely to
be less well-paid and volatile, leading to much lower
earnings. Third, if we consider female employment
in the 25 to 59 age group, while there has been a
decline of 7.7 million in the number of self-employed
workers, the number of paid workers rose by just 2.6
million (Chart 4). The increase in paid employment
here has been far short of the loss of self-employment.
Chart
3 >> Click
to Enlarge
These features have to be seen in the context of certain
changes observed in the sectoral composition of the
expansion of employment during the two periods. Though
there has been a change in industrial classification
adopted in the most recent survey, the National Industrial
Classification (NIC) 2004, we can assume that its
impact would not be substantial at the level of broad
categories.
The figures show that over 1999-2000 to 2004-05, the
increase in employment was distributed across agriculture,
manufacturing construction and services, though services
and construction dominated in the case of males and
agriculture in the case of rural females. As compared
to this, during the 2004-05 to 2009-10 period, agriculture
and manufacturing made negative or negligible contributions
to the increase in employment, whereas construction
played the dominant role in the case of both males
and females (Chart 5 and 6). Clearly even the small
contributions made by the commodity producing sectors
to employment increases are disappearing, making the
system dependent on construction and services, especially
the former.
In sum, even among sections of the population who
would not and have not been opting for education as
activity and for whom the identification of work participation
may not be difficult, the main source of employment
during the high growth years seems to be casual work
in the construction sector. This is likely to be among
the more volatile among employment categories, with
lower wages, higher uncertainty of employment and,
therefore, limited earnings potential. So even if
we take account of the increased participation of
the young in education and the possible underestimation
of the employment of women, the evidence seems to
point to unsatisfactory labour market outcomes in
the period when India transited to its much-celebrated
high-growth trajectory.
Chart
4 >> Click
to Enlarge
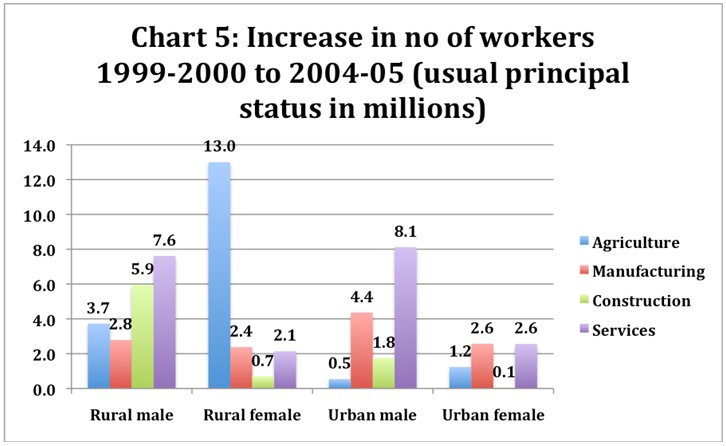
Chart 5 >> Click
to Enlarge
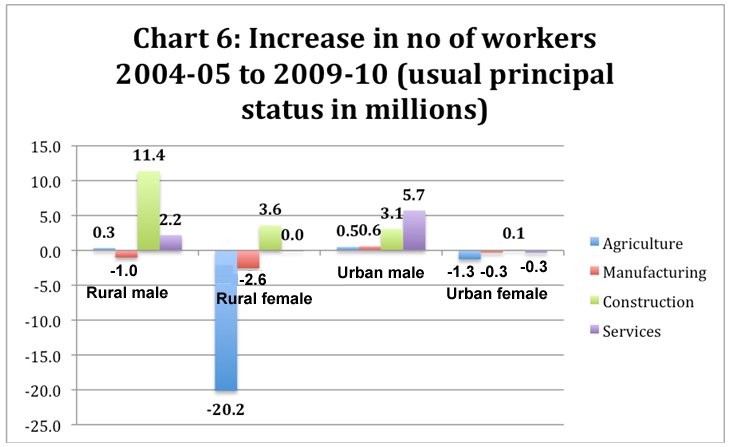
Chart
6 >> Click
to Enlarge
*
This article was originally published in The Business
Line on July 26, 2011.
