Portents
for the global economy are gloomy at best. And recent
events have already shown that the Indian economy
will be also be affected by adverse developments in
the rest of the world, whether through the impact
of mobile capital flows, or through exports being
dragged down by the recession in Europe and the economic
uncertainty in the US.
How resilient is the Indian economy at present, in
the face of these negative global forces? In terms
of domestic demand, it is certainly possible for the
government to think of ways of rejuvenating the economy,
ideally through more broad-based employment-led growth.
But externally, the recent pattern of growth has been
crucially related to India's greater global integration,
and therefore it has created patterns of dependence
on international markets and international capital.
This makes the economy significantly more vulnerable,
especially because the growth has been reliant on
capital inflows to generate domestic credit-driven
bubbles, rather than trade surpluses.
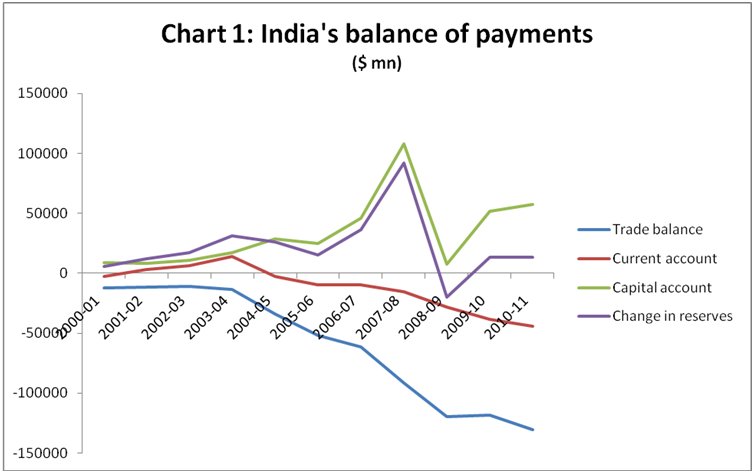
Chart 1 describes the main elements of India's balance
of payments. (All data in this and the following charts
are from the Reserve Bank of India's online statistical
database, accessed on 6 January 2012.) Several features
of importance emerge from this chart. First, the trade
balance has been negative and progressively worsened
over the course of the decade. Second, in the early
years of the decade, this impact could be kept in
check because remittance inflows and software exports
ensured that the current account was either in surplus
or ran small deficits. But in the second half of this
period, even large remittance inflows could not prevent
a substantial deterioration of the current account.
Third, despite this, external reserves have kept growing,
except for the crisis year 2008-09. Fourth, this was
entirely because of capital inflows, which increased
over the decade except in the crisis year, and the
capital account peaked in 2007-08 with more than $100
billion net inflow.
Chart
1 >>
(Click to Enlarge)
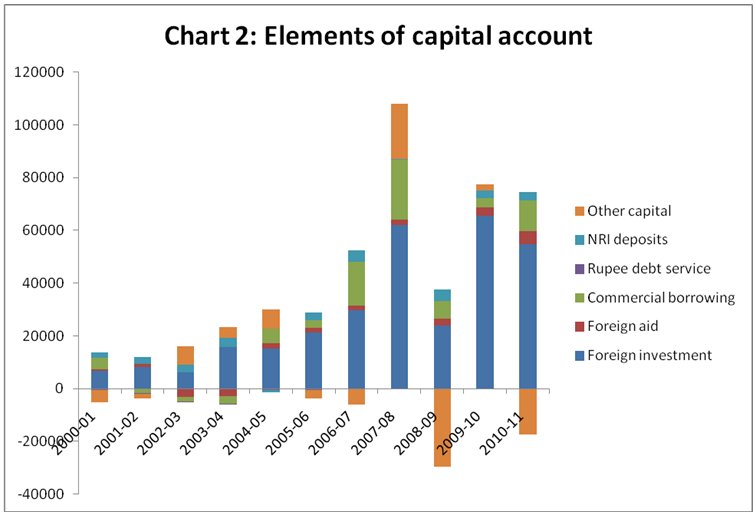
What this suggests is that India's external reserves
were effectively borrowed rather than earned, as they
were largely growing because of capital inflows that
were dominated by portfolio inflows and external commercial
borrowing. This is confirmed by Chart 2, which shows
that – especially in the second half of the decade
– foreign investment and external commercial borrowing
were dominantly responsible for the inflows on capital
account.
In this context, another recent feature of foreign
investment is worth noting. In the past, it made a
lot of sense to separate portfolio inflows from direct
foreign investment, on the grounds that the former
are typically more short-term in orientation and more
likely to be volatile and therefore exit the country
in periods of downswing. However, the emergence of
private equity, especially after 2000, has changed
this considerably, since this is typically included
in FDI. Private equity is also essentially short term
in orientation, since it seeks to make relatively
rapid capital gains on the acquisition of domestic
assets. A significant proportion of inward FDI into
India in the recent past has been in the form of private
equity. As a result, a significant proportion of inward
FDI is also effectively short term, and cannot be
assumed to be in for the long haul, any more than
explicitly portfolio inflows.
Chart
2 >>
(Click to Enlarge)
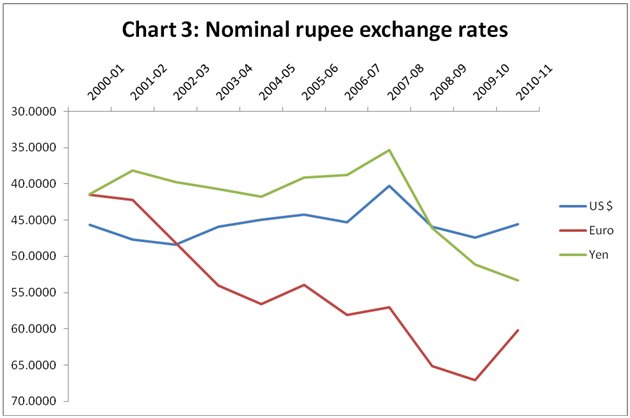
There is a widespread perception that the rupee has
depreciated significantly in recent times. Certainly,
in nominal terms vis-à-vis the major currencies,
there is evidence of substantial decline in value.
Chart 3 shows the rupee relative to the US dollar,
Euro and Japanese Yen. Nominal depreciation has been
particularly evident over much of 2011, which has
not been captured in this chart.
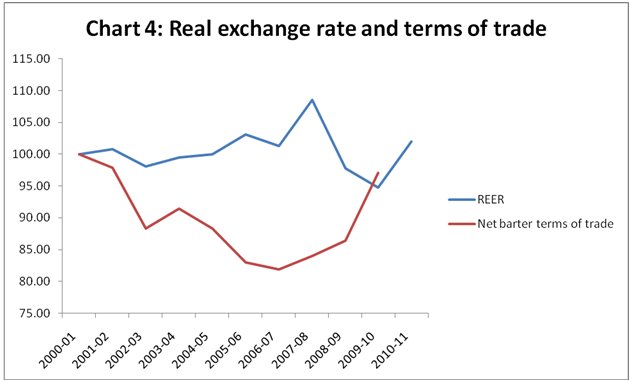
However, it should be noted that this was also a period
in which inflation in India was significantly higher
than in many if not most of its trading partners.
As a result, the real effective exchange rate, shown
in Chart 4, barely changed very much over the entire
course of the decade. The net barter terms of trade
declined until 2007, especially because of high world
oil prices, but then improved, so that even in terms
of this variable there was not much change by the
end of the decade.
Chart
3 >>
(Click to Enlarge)
Chart
4 >>
(Click to Enlarge)
Chart
5 >>
(Click to Enlarge)
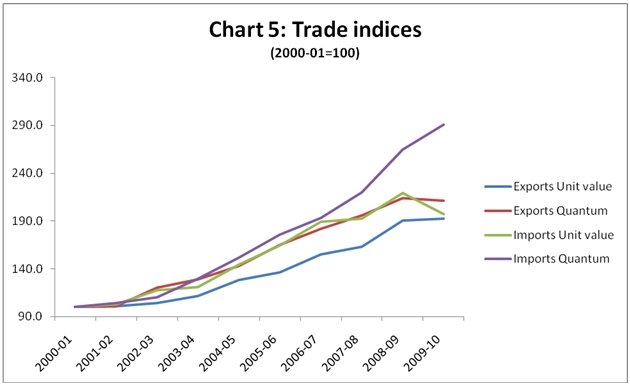
Chart 5 describes the indices of trade in terms of
quantum and unit value, separately for exports and
imports. This is an extremely significant chart, because
it highlights that the quantum index for imports moved
up much more rapidly than all the other indices. Further,
it does not seem to have been at all affected by the
global crisis. So it would be unwise to blame high
oil prices alone for the high and growing total import
bill – clearly import liberalisation has resulted
in a significantly increased propensity to import
within the economy.
This also has another implication: the domestic impact
is greater than would be evident from just the total
value of imports, since significantly greater quantities
of imports are entering the country. This has direct
effects on import-competing activities, on employment
and livelihood particularly of small producers. The
slow growth of non-agricultural employment despite
rapid aggregate GDP growth may be at least partly
related to the impact of substantially increased import
volumes of a wide range of manufactured commodities.
Chart
6 >>
(Click to Enlarge)
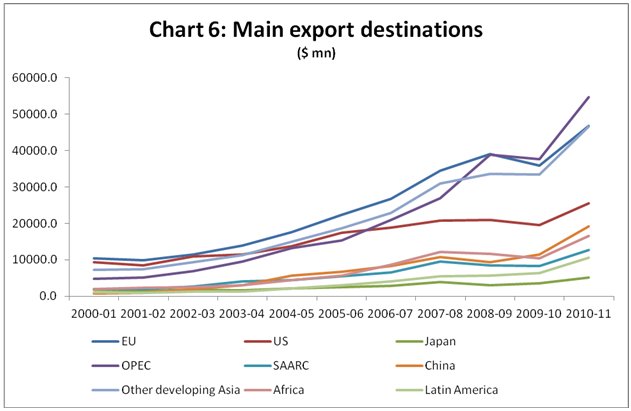
In terms of direction of trade, it is evident from
Chart 6 that the European Union remains an extremely
important destination for exports. This is bad news,
given the likely recession in Europe which is also
bound to affect their imports. OPEC as a group recently
overtook the EU in becoming the grouping to receive
the largest amount of India's exports (in value terms)
but it is worth noting that China and other developing
countries in Asia have become increasingly significant
as export markets for India.
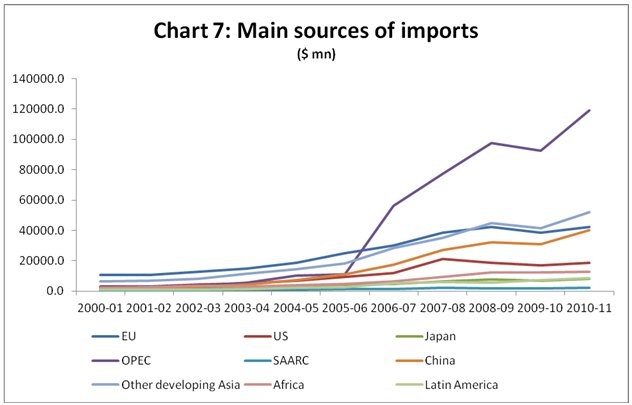
Chart 7 shows that in terms of imports, the global
increases in oil prices propelled OPEC countries dramatically
to the top of the groupings in terms of sources of
imports in the second half of the decade. But once
again, it is important to note that China and other
developing Asia have become major sources of imports,
exhibiting the fastest rate of growth for non-oil
imports.
Chart
7 >>
(Click to Enlarge)
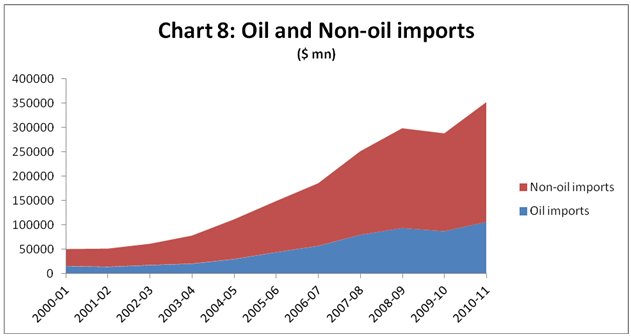
These non-oil imports have in fact been growing very
sharply. Chart 8 makes it clear that the recent increases
in the total import bill cannot be ascribed to oil
prices alone, because non-oil imports have been growing
much faster in value terms.
Chart
8 >>
(Click to Enlarge)
So recent trends in the external sector were already
cause for concern, even before the latest impact of
the ongoing global economic crisis can be felt. It
is not just high energy dependence which is a strategic
problem for India. The rapid expansion of non-oil
imports suggests an economy that (despite two decades
of liberalising ''reforms'') is becoming less externally
competitive and generating trade patterns that are
likely to continue to have adverse employment effects.
Most of all, a trajectory of growth based on capital
inflows that generate domestic finance-driven consumption,
including significantly high imports and worsening
trade balances, is obviously not sustainable. We do
not need a global crisis to recognise these danger
signals.
*This article was published
in the Business Line on January 9, 2012.
