Introduction
The Indian economy has been under a severe and consistent
inflationary pressure for the past couple of years.
While the inflation rate (point to point, WPI) was
4.5 per cent in January 2008, it increased to 12.8
per cent by August 2008. It was followed by a period
of low inflation till October 2009. But from November
onwards prices were on an accelerating trend again
and by April 2010 inflation rate touched 11 per cent,
hovering thereabout since then. This is in sharp contrast
to most of the 2000-2005 period when inflation rate
hardly ever crossed 7 per cent, and the last time
inflation crossed double digit was in May 1995.**
Therefore, the recent increase in rate of inflation
is quite striking not only because of the peaks, but
also because it appears to be a consistent phenomenon.
As it has snowballed into a social crisis and a possible
election issue, there has been a flurry of writings
from various quarters over the last year or so regarding
the reasons behind it, the impacts, and possible policy
suggestions. It seems that the inflation during 2008-09
was quite different from the most recent one. While
the increase in inflation rate during 2008-09 undoubtedly
had a global link associated with rise in the prices
of mineral oils, metals, and food grains globally,
this time around, inflation does appear to be an India-specific
phenomenon, as there are no major global factors at
play. In addition, researchers have also argued that
instead of countering the global trends, our domestic
policies, especially those related to money supply,
had consolidated and stimulated the inflationary trends
during 2008 (Marjit, 2008), whereas the current phase
of rising inflation is in the face of tight money
policy. Moreover, though inflation is supposed to
weaken the purchasing power of a currency, recent
inflation in India has been accompanied by the rupee’s
relative strengthening against international currencies,
especially the US dollar. This suggests that current
inflation is more a structural problem arising from
supply side constraints both on the production as
well as distributional fronts, especially in food
commodities. It appears that factors like lack of
capital formation in agriculture, withdrawal of the
State from irrigation and extension activities, speculation
& commodity trading with a practically non-existent
Public Distribution System, have also contributed
to the crisis. Some economists have been consistently
pointing out that domestic policy lapses in these
areas are the main reason behind persistent and increasing
rates of prices (Chandrasekhar, 2008, 2010), but their
arguments seem to be falling on deaf ears.
While there has been no dearth of macroeconomic projections,
most of the analysis has been on the growth impact
of inflation and almost nothing on the distributional
impact (a notable exception has been Ghosh, 2009).
The present article focuses on this specific issue
of distributional impact of current inflation by quantifying
the differential impact of the current inflation on
different income groups of the society.
Trends in WPI and CPI Inflation Indices
Inflation rate in India is officially measured through
changes in the Wholesale Price Index (WPI). In addition,
effective inflation for consumers is measured through
changes in the Consumer Price Index (CPI). While most
analysis has been based on the aggregate WPI, we are
more concerned about price trends in different commodity
groups, especially those in the CPI. We therefore
look at inflation in three broad groups of commodities
- Food, Fuel, and Others.
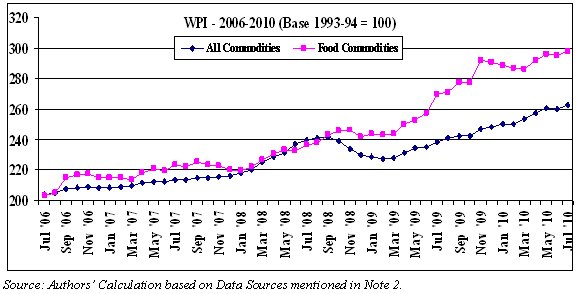
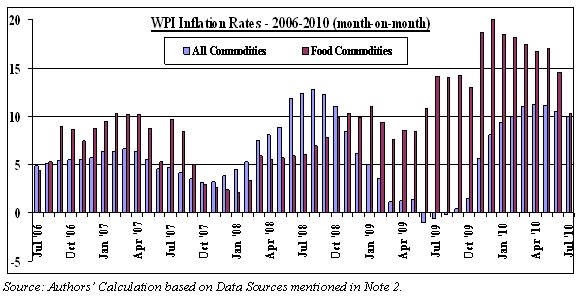
It is observed that the current bout of inflationary
pressure started roughly in December 2007, and WPI
Inflation, which had remained in the 4-6 per cent
band for a long period of 26 months – January 2006
to March 2008 –climbed up sharply to supra-10 figures,
first in June 2008, and then again in February 2010.
Food price inflation increased sharply during March-April
2008, crossed double-digit mark in June 2009, reached
a peak of 20 per cent in December 2009, and declined
marginally thereafter. The inflation rate for the
Fuel group was quite high during 2004-05, declined
till November 2007, and increased steeply thereafter.
It remained negative for most of 2009, but rose sharply
again during 2010. Inflation in the Non-Food–Non-Fuel
sector was initially low but is increasing and shadowing
the WPI inflation in recent past. The most recent
figures obtained from the Government of India put
the inflation rates at 10.0 per cent (WPI), 10.3 per
cent (Food), 14.3 per cent (Fuel), and 8.5 per cent
(Non-Food–Non-Fuel) for July 2010.
Chart
1 >> Click
to Enlarge
While
headline inflation has been much talked of, the man
on the street is more concerned about the price (s)he
pays for commodities. Rise in prices paid by the common
person is reflected by the CPI. Consumers in rural
areas are affected by movements in CPI for Agricultural
and Rural Labourers (CPIAL), while those in urban
areas are concerned with CPI for Industrial Workers
(CPIIW) and CPI for Urban Non-manual Employees (CPIUNME).
Inflation in CPI lagged behind the WPI and started
the current northward journey from January 2008 onwards.
However, unlike WPI which showed decelerating trend
in 2009, CPI Inflation has been significantly high
throughout the last four years and instead of slowing
down is on the rise over the last few months. This
is all the more disconcerting because the deceleration
in WPI over most of 2009 was associated with global
recession, which led to loss of jobs and decreased
income for a large part of Indian populace. Thus,
while most incomes remained stagnant, consumer prices
were on the rise. Even among the sectors, increase
in CPIAL has been greater than CPIIW or CPIUNME indicating
that prices in rural areas have increased at a faster
pace than those in the urban areas.
At a disaggregated level, rise in CPI for the Food
group has been higher than that in overall CPI, especially
in the most recent past, seemingly confirming our
earlier observation that the present inflation is
a supply side problem. CPI for Fuel showed a decelerating
trend till April 2008, and has been erratic throughout
the period, probably because of the administered prices
of fuel. Interestingly, fuel prices in rural areas
have increased at a much faster rate compared to those
in urban areas. This is due to the greater share of
Firewood in the calculation of CPIAL and also due
to the nature of the unregulated and unorganised fuel
market in rural areas. The recent shift in fuel price
policy to a market based regime is expected to be
reflected in a more systematic movement in Fuel price
inflation in line with global prices. Thus with global
crude prices firming up, the common man is going to
be hit harder.
Chart
2 >> Click
to Enlarge
What is significant is that inflation has been most
severe in the foodgrains group. Since a large part
of the consumption expenditure of the majority of
people is on food, which has a very low price elasticity,
the common man has been affected most severely. Also,
because of the low weight of the Food group in the
WPI, headline inflation has not revealed the true
misery of people.
If we look at the rates of price increase, we find
that over the last four years WPI has increased by
about 29 per cent (Table 1). Rise in CPI has been
substantially higher, with urban price indices rising
by around 40 per cent and rural prices increasing
by about 49 per cent. Prices of Food have increased
the most – more than 50 per cent – followed by Fuel
prices in rural areas. It thus transpires that the
purchasing power of common people has declined by
about 49 per cent in rural areas and more than 40
per cent in urban areas over the last four years.
However, this impact has not been uniform; the suffering
has been uncommon to some groups, which we explore
in the next section.
Table
1: Rates of Increase in Price Indices |
Indicator |
Weight |
Percentage
Increase During |
July
2006 –
July 2007 |
July
2007 –
July 008 |
July
2008 –
July 2009 |
July
2009 –
July 2010
|
July
2006 –
July 2010 |
WPI
All |
100.0 |
4.9 |
11.7 |
-0.1 |
10.0 |
28.7 |
Food |
15.4 |
8.7 |
6.3 |
14.9 |
10.3 |
46.5 |
Fuel |
14.2 |
-1.5 |
17.1 |
-10.3 |
14.3 |
18.2 |
Others |
70.4 |
5.4 |
11.8 |
-1.4 |
9.0 |
26.9 |
|
CPIAL
All |
100.0 |
8.6 |
9.4 |
12.9 |
11.0 |
48.9 |
Food |
66.7 |
9.6 |
10.7 |
9.9 |
15.6 |
54.1 |
Fuel |
7.9 |
6.5 |
8.5 |
9.0 |
14.1 |
48.9 |
Others |
25.4 |
6.7 |
6.2 |
21.9 |
14.1 |
35.3 |
|
CPIIW All |
100.0 |
6.1 |
8.3 |
11.9 |
13.7 |
40.4 |
Food |
46.2 |
8.4 |
11.8 |
14.7 |
17.3 |
48.9 |
Fuel |
6.4 |
7.4 |
6.2 |
2.1 |
3.4 |
19.2 |
Others |
47.4 |
3.6 |
5.3 |
10.5 |
11.6 |
34.9 |
|
CPIUNME-All |
100.0 |
6.4 |
7.4 |
13.0 |
14.1 |
41.2 |
Food |
46.2 |
9.4 |
10.0 |
15.3 |
9.7 |
52.1 |
Fuel |
6.4 |
7.0 |
6.2 |
2.1 |
5.4 |
22.3 |
Others |
47.4 |
3.4 |
5.0 |
12.3 |
19.6 |
33.0 |
|
Source:
Press Releases of Government of India, Various
Issues; Reports on Price Indices obtained from
Ministry of Statistics and Programme Implementation,
Various Issues. See Note 2. |
Table
1 >> Click to Enlarge
Distributional Impact: Who are the worst sufferers?
While everyone except speculators are adversely affected
by the current inflation, some groups are more so
than the rest. At a theoretical level, it has been
postulated that inflation favours the profit earners
(the rich, mostly) and robs the wage earners (the
middle and low income groups). While incomes of the
former group are mostly indexed to prices, incomes
of the latter groups follow prices only after a lag,
and even then they are often not compensated fully.
Apart from this textbook rendition of the distributional
impact of inflation, effective inflation faced by
different socio-economic groups would be different
also because of their different consumption patterns.
We try to quantify the impact of the recent inflation
on different income groups in India.
As price rises are not uniform across commodity groups,
effective inflation would depend on the consumption
pattern of families. Since the commodity baskets of
the lower income groups are different from those of
the high income groups, effective inflation rates
faced by them are also dissimilar.
Periodical surveys from National Sample Survey Office
(NSSO) provide data on the consumption pattern of
different economic groups. NSSO data divides the population
into Twelve Monthly Private Consumption Expenditure
(MPCE) classes and the shares of different commodity
groups in total expenditure are provided for each
of these classes separately. The bottom four MPCE
classes can be taken as the Low Income Group, while
the top four can be considered as the High Income
Group. The middle four MPCE classes can be taken to
represent the Middle Income Group.
Table
2: Consumption Pattern of Indian Households |
MPCE
Classes |
Average
MPCE
(Rs per capita)
|
Shares
of Commodity Groups in Total Expenditure (%) |
Food |
Fuel |
Others
|
Rural
– I |
195 |
68.3 |
13.6 |
18.1 |
Rural
– II |
256 |
67.2 |
13.4 |
19.4 |
Rural
– III |
298 |
61.9 |
11.3 |
26.8 |
Rural
– IV |
343 |
60.8 |
11.7 |
27.5 |
Rural
– V |
387 |
59.3 |
11.1 |
29.6 |
Rural
– VI |
433 |
60.1 |
10.8 |
29.1 |
Rural
– VII |
482 |
59.3 |
10.8 |
29.9 |
Rural
– VIII |
542 |
58.1 |
10.3 |
31.6 |
Rural
– IX |
631 |
55.8 |
10.2 |
34.0 |
Rural
– X |
775 |
53.4 |
9.7 |
36.9 |
Rural
– XI |
1003 |
49.8 |
9.1 |
41.1 |
Rural
– XII |
1743 |
33.7 |
5.9 |
60.4 |
|
|
|
|
|
Urban
– I |
283 |
64.9 |
14.3 |
20.8 |
Urban
– II |
368 |
63.0 |
13.3 |
23.6 |
Urban
– III |
444 |
56.7 |
12.3 |
31.0 |
Urban
– IV |
533 |
55.3 |
12.5 |
32.2 |
Urban
– V |
627 |
52.5 |
12.0 |
35.4 |
Urban
– VI |
732 |
50.4 |
11.8 |
37.8 |
Urban
– VII |
859 |
48.2 |
11.4 |
40.4 |
Urban
– VIII |
1010 |
45.9 |
10.7 |
43.4 |
Urban
– IX |
1227 |
42.4 |
10.1 |
47.5 |
Urban
– X |
1599 |
38.8 |
9.0 |
52.1 |
Urban
– XI |
2156 |
35.6 |
8.8 |
55.6 |
Urban
– XII |
3943 |
23.6 |
6.0 |
70.4 |
|
|
|
|
|
Rural
Low Income |
299 |
67.7 |
13.5 |
18.8 |
Rural
Middle Income |
468 |
61.5 |
11.4 |
27.0 |
Rural
High Income |
927 |
39.1 |
7.0 |
53.9 |
Rural
- All |
625 |
53.3 |
9.7 |
37.0 |
|
|
|
|
|
Urban
Low Income |
445 |
63.8 |
13.8 |
22.4 |
Urban
Middle Income |
813 |
49.7 |
11.5 |
38.8 |
Urban
High Income |
1985 |
27.6 |
6.9 |
65.4 |
Urban
- All |
1171 |
40.0 |
9.4 |
50.7 |
Source:
Authors’ calculations based on NSSO Report
No 523, Household Consumption Expenditure in
India 2005-06, GOI (2008) |
Table
2 >> Click to Enlarge
This enables us to derive the consumption basket of
the bottom, middle and top fractile income classes.
Using NSSO data for 2006-07, it is observed that Fuel
& Light has the lowest share in total expenditure
for all the three income groups (Table 2). For the
Low and Middle Income people, Food commodities constitute
the largest consumption expenditure group, while the
largest share of expenditure goes to Non-Food Non-Fuel
commodities for the High Income group consumers.
These shares of Food, Fuel and Others in the commodity
basket of different classes of people have been used
as weights to derive the effective inflation rates
faced by the different income groups from the commodity-group
CPIs. While CPIAL is used for rural sector, simple
average of CPIIW and CPIUNME has been used for the
urban sector. This provides us with the Effective
Consumer Inflation Rate for the six groups of people
considered (Table 3). Since essential items like Food
and Fuel feature more prominently in the basket of
the LIG people and these items have experienced relatively
higher price rise during the study period, effective
inflation rates are higher for the poorer section
of the people, both in the rural and the urban areas.
It also appears that the urban consumers have suffered
more erosion of purchasing power during 2009-2010,
mainly because of the inflation in Non-Food–Non-Fuel
commodities, which feature heavily in their consumption
basket. However, it is still price rise in food commodities
that hurts people most since these are basic to a
decent standard of living.
Table
3: Effective Inflation Rates Faced by Different
Economic Groups |
MPCE
Groups |
Percentage
Decrease in Purchasing Power During |
July
2006 –
July 007 |
July
2007 –
July 2008 |
July
2008 –
July 2009 |
July
2009 –
July 2010 |
July
2006 –
July 2010
|
Rural
Low Income |
8.6 |
9.6 |
12.1 |
12.1 |
49.9 |
Rural
Middle Income |
8.4 |
9.3 |
13.1 |
10.7 |
48.4 |
Rural
High Income |
7.8 |
8.1 |
16.3 |
6.1 |
43.6 |
|
|
|
|
|
|
Urban
Low Income |
7.5 |
8.9 |
12.4 |
13.7 |
42.7 |
Urban
Middle Income |
6.6 |
8.1 |
12.1 |
13.3 |
40.6 |
Urban
High Income |
5.3 |
6.8 |
11.8 |
14.1 |
37.6 |
Source:
Authors' Calculations. |
Table
3 >> Click to Enlarge
Over the last four years the impact has therefore
been hardest on the lower income people, especially
those in the rural areas. It is observed that the
purchasing power has declined by about 50 per cent
for the Rural Low Income Group people compared to
about 38 per cent for the Urban High Income Group
people. In addition, since a majority of the lower
income groups are wage earners and that too from the
unorganised sector, their incomes are not compensated
for the price rise. On the other hand, most of the
people in the highest income groups are either profit
earners or engaged in the organised sector. Therefore,
their incomes are frequently indexed to price rise
and they are somewhat compensated against the inflationary
trends.
If we consider the fact that per capita income has
increased by about 40 per cent over the last 4 years
(in nominal terms) and assuming (though unrealistically)
that this growth has been shared equally by all the
groups of people, we still arrive at a fall in real
income for five of the six groups considered by us.
Only the urban HIG people seem to have had a rise
in real income under such restrictive assumption.
If we now contemplate the reality that most of the
recent income growth have benefited the upper echelons
of the society we can easily comprehend the uncommon
immiseration of the already marginalized group that
has taken place, especially at the countryside.
This has wider socioeconomic implications since the
erosion in the purchasing power due to current inflation
has been biased against the poor, decreasing their
real per capita incomes disproportionately. This has
been worsening the already widespread economic inequality
in India and this is perhaps the most appalling impact
of current inflation. We hope that the present commentary
stirs up some thoughtful debate on the wider socioeconomic
impact of the distributional effects of the specific
type of inflation currently prevailing in India and
that appropriate policies are formulated before the
resultant inequality goes out of control.
* Authors are Associate
Professor and Reader respectively at the Department
of Economics, University of Burdwan, India. Authors
are grateful for valuable communications with Dipa
Mukherjee, Saikat Sinha Ray, and Pinaki Chakraborti.
Disclaimers apply. Correspondence: meriju@rediffmail.com.
** Note: Data used in this article
are obtained from – RBI Bulletin, various years, [available
at http://www.rbi.org,
accessed on 12/08/2010]; Reports on Consumer Price
Indices for Agricultural & Rural Labourers and
for Industrial Workers, Various Issues [available
from http://www.labourbureau.nic.in
accessed on 28/08/2010]; Reports on Wholesale Price
Indices and Consumer Price Indices for Urban Non-Manual
Employees, Various Issues [available from http://www.mospi.nic.in
accessed on 26/08/2010].
References
Chandrasekhar, C.P. (2008) ''Inflation: How Much and
Why'',
Macroscan,
17th April, 2008 [available from http://www.macroscan.org/cur/apr08/print/
prnt170408Inflation.htm,
accessed on
12/08/2010]
Chandrasekhar, C.P. (2010) ''Engineered Inflation'',
Macroscan,
2nd August, 2010 [available from http://www.macroscan.org/cur/aug10/print/
prnt020810Inflation.htm,
accessed on
12/08/2010]
Ghosh, Jayati (2009)
''Prices and Politics in India'', Macroscan,
24th
March, 2009 [available from http://www.macroscan.org/cur/mar09/print/
prnt240309Prices_Politics.htm,
accessed on 12/08/2010]
Marjit, Sugata (2008)
''Inflation and Public Policy:
Contemporary Dilemmas'', Economic and
Political Weekly, Vol. 43, No. 36
September 6, 2008.
