| |
|
 |
|
|
Women
Workers in Urban India |
| |
| Feb
6th 2007, C.P. Chandrasekhar and Jayati Ghosh |
|
In
the era of globalisation, it has become commonplace
to argue that trade openness in particular generates
processes that encourage the increased employment of
women, particularly in export-oriented activities. In
addition, development in general and higher per capita
incomes are supposed to lead to more employment in services
and shifts from unpaid household work to paid work,
which also involve more paid jobs for women workers.
Data
from the recent large sample employment survey of the
NSSO would appear to provide confirmation of this perception.
Work participation rates of women workers have increased
in 2004-05, not only in comparison with 1999-2000 when
they had fallen sharply, but also in comparison to a
decade earlier. However, this process needs to be considered
in more detail to see whether it is indeed the positive
process outlined above. Since this is meant to be much
more marked in urban areas, this article is concerned
with changes in employment patterns of urban women workers
in India.
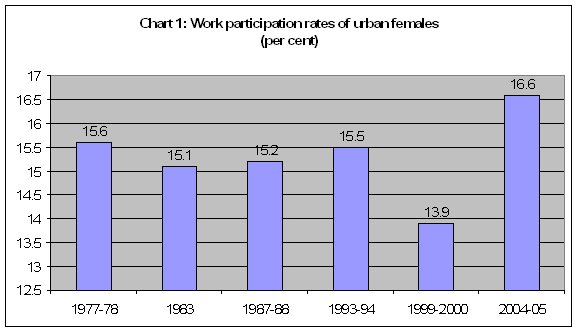
As Chart 1 shows, work participation rates have indeed
increased and in 2004-05 were at the highest rate of
the past 25 years. (The year 1999-2000 now appears to
be a significant outlier, and other problems with that
data suggest that the long terms trends are confirmed
by the most recent data.) Of course, these work participation
rates are still low by international standards, and
reflect substantial variation across states, with southern
states showing generally higher rates.
Chart
1 >> Click
to Enlarge
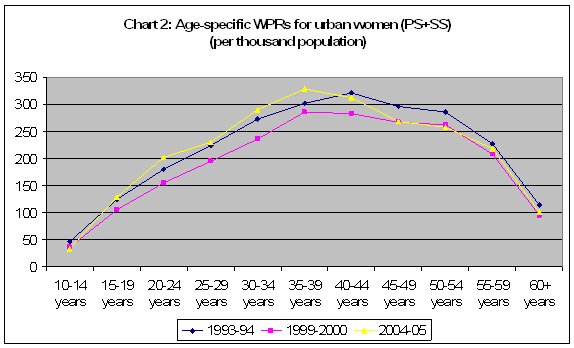
Chart 2 shows how the age specific work participation
rates for urban women have changed over the past decade.
There is a general tendency for women to enter into
paid work at younger ages than previously - participation
rates among younger urban women increased by about
2 percentage points compared to 1993-94 and 5 percentage
points compared to 1999-2000. And the peak work participation
rate for urban women has shifted from the age group
40-44 years in 1993-94 to 35-39 years in 2004-05.
Chart
2 >> Click
to Enlarge
So what type of employment do urban women workers
find? Table 1 shows that there has been an overall
decline in casual employment and a general increase
in regular work and self-employment. The shift is
especially marked in the case of principal activity,
with more than 42 per cent of urban women workers
now reporting themselves as having a regular job.
When subsidiary activities are included, self-employment
assumes greater significance, with nearly 48 per cent
reporting as self-employed.
Table
1: Type of employment of usually employed urban
women |
|
Principal
Status only |
Principal
+ Subsidiary Status |
|
|
Self-employed |
Regular |
Casual |
Self-employed |
Regular |
Casual |
|
1983 |
37.3 |
31.8 |
30.9 |
45.8 |
25.8 |
28.4 |
1987-
88 |
39.3 |
34.2 |
26.5 |
47.1 |
27.5 |
25.4 |
1993-
94 |
37.2 |
35.5 |
27.3 |
45.8 |
28.4 |
25.8 |
1999-
2000 |
38.4 |
38.5 |
23.1 |
45.3 |
33.3 |
21.4 |
2004-
05 |
40.4 |
42.2 |
17.4 |
47.7 |
35.6 |
16.7 |
Table 1 >> Click
to Enlarge
This is certainly a phenomenon to be welcomed, especially
if it does indeed indicate a shift to more productive
and better remunerated activities than are to be found
with casual contracts. However, this needs to be confirmed
with evidence on the specific activities that are engaged
in and the trends in wages.
Table 2 provides the evidence on the broad sectoral
classification of work of urban women. Predictably,
agriculture shows a substantial decline over time. However,
elsewhere there are surprises. The share of manufacturing
has increased slightly, but at around 28 per cent it
is not much higher than the proportion achieved in 1987-88,
that is well before any export-led manufacturing boom
was in evidence. So the overall proportion of women
in manufacturing employment in urban India does not
support the notion of a big increase in female employment
consequent upon greater export orientation of production.
Table
2: Main sectors of employment of urban women
workers
(Principal plus subsidiary status)
|
|
Per
cent of usually employed urban women |
|
|
1983 |
1987-88 |
1993-94 |
1999-2000 |
2004-05 |
|
Agriculture |
31 |
29.4 |
24.7 |
17.7 |
18.1 |
|
Manufacturing |
26.7 |
27 |
24.1 |
24 |
28.2 |
|
Construction |
3.1 |
3.7 |
4.1 |
4.8 |
3.8 |
Trade, hotels &
restaurants |
9.5 |
9.8 |
10 |
16.9 |
12.2 |
Transport &
communications |
1.5 |
0.9 |
1.3 |
1.8 |
1.4 |
|
Other services |
26.6 |
27.8 |
35 |
34.2 |
35.9 |
Table 2 >> Click
to Enlarge
Even trade, hotels and restaurants, which are activities
traditionally considered to attract a lot of women workers,
do not show much increase, and the share of these has
even declined compared to 1999-2000. The clear increase,
even if not very dramatic, is for other services, which
is a catch-all for a wide range of both public and private
services, as well as both high value added high-remuneration
jobs and very low productivity low paying survival activities.
It is worth considering the patterns in manufacturing
employment in more detail, particularly because the
work of women can be easily misclassified in the available
data. In particular, the usual status definition which
includes both principal and subsidiary status activities
can be a source of confusion. It is possible that women
are classified as ''usually working'' when in fact it
may reflect underemployment or engagement in a subsidiary
activity only. Indeed, there can be substantial variation
in the type of employment contract depending upon whether
the activity is a ''principal'' one or a ''subsidiary''
one.
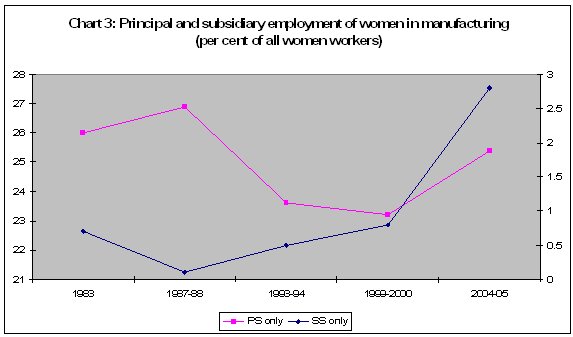
Chart 3 makes this very evident in the case of manufacturing
employment. In terms of principal status, the share
of women workers in manufacturing has fluctuated sharply
between 23 and 27 per cent, and there is no evidence
of a clear trend. However, the share of women working
in manufacturing in a subsidiary capacity (that is,
not as the perceived principal activity of the women
concerned) has been increasing continuously since 1987-88,
and now accounts for as much as nearly 3 per cent of
all urban women workers. This in turn is now as much
as 11 per cent of all women employed in manufacturing
- surely not a small proportion.
Chart
3 >> Click
to Enlarge
What could explain this very substantial difference
once subsidiary activities are included? One important
factor may be the increase in putting out home-based
or other work as part of a subcontracting system for
export and domestic manufacturing. Such work does not
get incorporated in the employment statistics which
are based on employers' records, and this may explain
the paradox that even while women's share of employment
in manufacturing has not increased much, the dependence
of the sector - and especially of export-oriented manufacturing
- on the productive contribution of women may well have
increased.
This suggests that the direct and formally recognised
involvement of women may have stagnated even in the
period of the relative higher growth of exports over
the last decade. However, home-based subcontracting
activities, or work in very small units that do not
even constitute manufactories, often on piece rate basis
and usually very poorly paid and without any known non-wage
benefits, may to some extent have substituted for the
more standard form of regular employment on a regular
wage or salary basis.
Table 3 provides some data on the actual numbers of
women employed in various activities in urban India,
based on applying the NSSO work participation rates
to the Census estimates and projections of urban population.
The results are quite startling, especially in the context
of the much-trumpeted high output growth rates which
are widely felt to have predominantly affected urban
India in positive ways.
Thus, it turns out that relatively few sectors now account
for two-thirds of all women workers, whether in principal
or subsidiary status. Some of them are indeed the dynamic
export-oriented activities. Thus, the number of women
employed in textiles has nearly doubled and those in
apparel and garments have increased by more than two
and a half times. There has also been significant increase
in employment in the leather goods sector.
In the service sectors, there has been very little increase
in female employment in public administration, reflecting
the overall constraints on such employment, although
employment in education (mainly with private employers)
has shown a large increase. However, the biggest single
increase after apparel - and the category of work that
is now the single largest employer for urban India women
- has been among those employed in private households.
In other words, women working as domestic servants now
number more than 3 million, and account for more than
12 per cent of all women workers in urban India.
Table
3: Main sectors of employment of urban women
workers |
|
1999-2000 |
2004-05 |
per
cent change |
Food products &
beverages |
400,441 |
418,593 |
4.5 |
|
Tobacco products |
891,891 |
911,055 |
2.1 |
|
Textiles |
1,037,506 |
1,920,602 |
85.1 |
|
Apparel |
436,845 |
1,600,502 |
266.4 |
Leather & leather
goods |
72,807 |
196,985 |
170.6 |
Chemicals & chemical
products |
345,835 |
467,839 |
35.3 |
|
Construction |
873,690 |
935,678 |
7.1 |
|
Retail trade |
2,493,656 |
2,117,587 |
-15.1 |
|
Hotels & restaurants |
400,441 |
615,578 |
53.7 |
|
Finance |
273,028 |
418,593 |
53.3 |
Pub admin, defence
&
social security |
709,873 |
763,316 |
7.5 |
|
Education |
2,056,811 |
2,856,280 |
38.9 |
Employed in private
households |
946,497 |
3,053,265 |
222.6 |
|
|
|
|
|
|
Total |
10,939,321
|
16,275,871 |
|
|
per cent of all workers |
60
|
66 |
|
All urban women
workers |
18,201,866
|
24,623,103 |
|
Table 3 >> Click
to Enlarge
It is indeed disturbing to see that the greatest labour
market dynamism has been evident in the realm of domestic
service. This is well known to be poorly paid and often
under harsh conditions - and certainly, it cannot be
seen as a positive sign of a vibrant dynamic economy
undergoing positive structural transformation.
The newer activities that are much cited - such as IT
and finance - continue to absorb only a tiny proportion
of urban women workers, which is why they have not been
included in this table. Thus, women workers in all IT
related activities - that is, computer hardware and
software as well as IT-enabled services - account for
only 0.3 per cent of the urban women workers in this
large sample, amounting to an estimated total of 74,000
workers at most.
Similarly, women workers in all financial activities
- that is formal financial intermediation through banks
and other institutions, life insurance and pension activities
and other auxiliary financial activities - added up
to only 1.4 per cent of the women workers in urban India.
So there is clearly a long way to go before the newer
sectors - or even traditional but more dynamic exporting
sectors such as textiles and garments - can make a dent
in transforming labour conditions for urban Indian women.
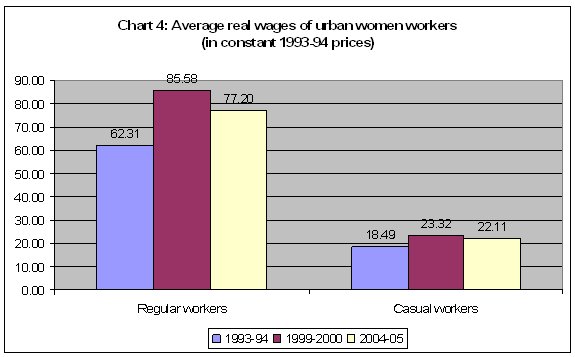
This is probably why the evidence on real wage trends
of urban women is so disappointing. Chart 4 indicates
that average real wages have fallen between 1999-2000
and 2004-05 for both regular and casual women workers,
and have hardly increased much even in relation to more
than a decade earlier. For an economy that boasts of
one of the highest GDP growth rates in the world over
this period, this is certainly an indictment.
Chart
4 >> Click
to Enlarge
|
| |
|
Print
this Page |
|
|
|
|
