The
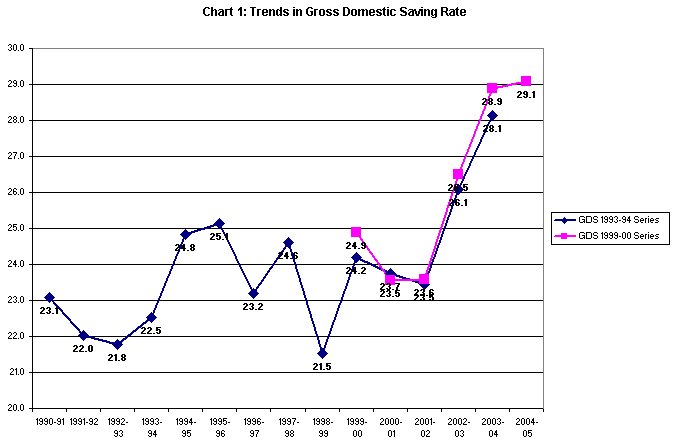
domestic savings rate or the ratio of gross savings
to GDP is estimated by the CSO to have touched a record
level of 29.1 per cent in 2004-05. This implies an
increase of 5.5 percentage points since 2001-02, before
which the rate had remained stagnant and even declined
since the mid-1990s. The recent revision of the weighting
system and revision of the base year from 1993-94
to 1999-00 has made a difference to the savings rate
estimates for individual years for which estimates
for both series are available. But the trend remains
broadly the same. The initial rise in the savings
rate was captured by the old series. And provisional
estimates for 2004-05 from the new series suggest
that the trend has continued. Overall, the rise in
the savings rate has coincided with an increase in
the rate of growth of GDP over the last three years,
suggesting that the economy is transiting to a sustainable,
higher growth trajectory.
The question naturally arises as to the factors that
are responsible for the rise in savings. In particular,
given the necessarily complex way in which savings
and investment are estimated in an economy like India
with a large household sector, including unincorporated
enterprises, the question arises as to whether the
sudden increase is more statistical than actual. In
fact, since the current savings surge coincides with
a massive increase in the inflow of portfolio FII
investment in India’s stock and debt markets, it had
been argued (see S.L. Shetty in Economic and Political
Weekly, February 12, 2005, for example) that some
of this capital may have been lodged with the banks
and got erroneously recorded as constituting household
savings invested in financial assets.
Chart
1 >> Click
to Enlarge
A priori this is indeed a possibility. Savings are
estimated by dividing the universe of savers into
the public sector, the private corporate sector and
the household sector (including unincorporated enterprises).
Public sector saving is computed from budgetary data,
and captures the excess of government expenditure
at the central and state levels over revenue; and
private corporate sector savings in the form of retained
earnings are obtained from company balance sheet data.
Household savings are estimated in two parts. First,
household financial savings, estimated using data
on the assets and liabilities of the financial sector,
adjusted for its outstanding positions with the public
and private corporate sector. Second, household savings
in physical assets which is the excess of aggregate
capital formation estimated by the product flow method
(or the availability of items like machinery, equipment
and construction material that enter into capital
formation) over the estimated capital formation in
the public and private corporate sectors based on
budgetary data and company balance sheets.
It should be clear from the above that household saving
is derived as a residual category in the case of both
household financial saving and household savings in
physical assets (or household capital formation).
It should be clear that if funds transferred by FIIs
for investment purposes are parked in bank deposits
or other financial instruments before being invested
in corporate equity and bonds, there is a possibility
that they could be attributed to the household sector.
Similarly if aggregate capital formation derived through
the product flow method is overestimated, then assuming
that estimates of capital formation in the public
and private sectors are correct, there would be an
overestimation of ''physical savings'' in the household
sector.
Chart
2 >> Click
to Enlarge
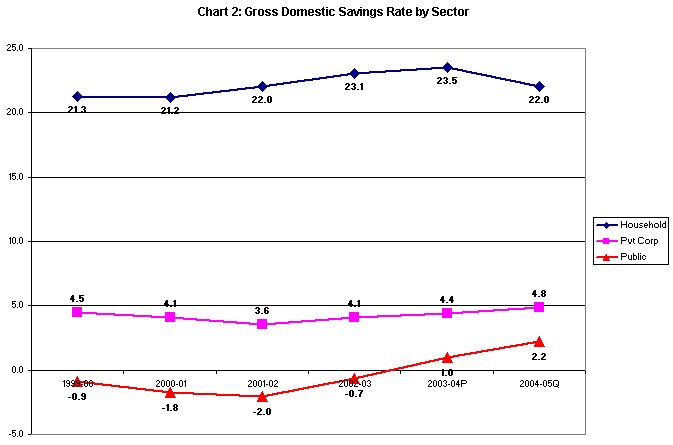
These issues are of relevance because the gross savings
rate in the household sector had indeed risen between
2000-01 and 2003-04 (provisional) (Chart 2). However,
there are two features of movements in the sectoral
savings rate that need to be noted. First, while the
increase in the economy-wide gross savings rate between
these two years amounted to 5.4 percentage points,
that in the case of the household sector totaled 2.3
percentage points. That is, movements in household
sector savings account for much less than half of
the increase in the aggregate savings rate between
these two years. Second, if we consider the quick
estimates for 2004-05, we find that the savings rate
in the household sector fell by 1.5 percentage points,
whereas the aggregate savings rate rose by a further
0.2 of a percentage point. Overall, between 2001-02
and 2004-05 while the aggregate savings rate rose
by 5.5 percentage points the household savings rate
was stagnant.
Chart
3 >> Click
to Enlarge
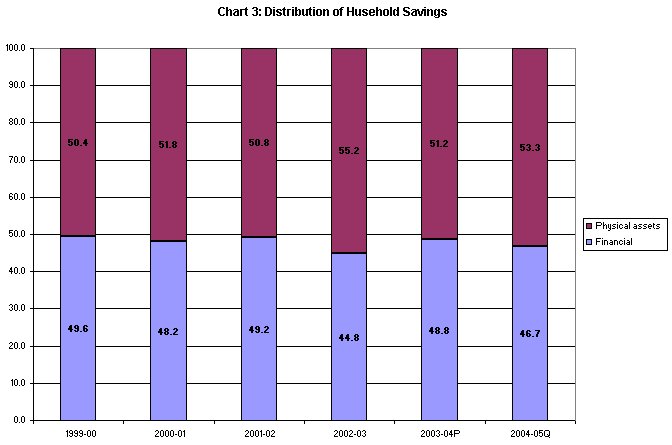
Another point to note is that the composition of the
household savings rate (Chart 3) has not changed significantly
in favour of financial instruments. In fact the share
of financial savings has been more or less stagnant,
falling in individual years like 2002-03 and 2004-05.
This weakens the argument that the rise of in the
aggregate savings rate could have been the result
of a mis-categorisation of float FII funds as household
savings.
In fact, a close examination of sectoral savings trends
(Chart 2) suggests that the sector responsible for
the rise in the savings rate is the public sector,
which has seen a sharp transformation of its dissaving
into saving in the years since 2001-02 and 2004-05.
During this period, the public sector saving rate
rose from a negative 2.0 per cent to a positive 2.2
per cent, contributing a remarkable 4.2 percentage
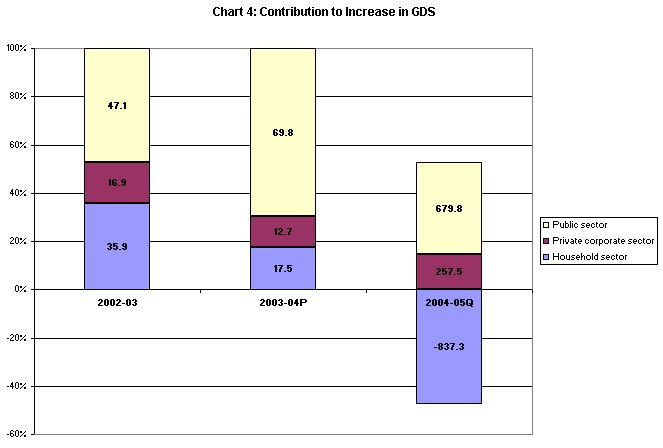
points increase to the savings rate. Together with
a small contribution from the private corporate sector,
this been primarily responsible for the statistically
recorded savings surge. This comes through from Chart
4 which shows the major role played by reduced public
sector dissaving or increased public saving to the
increase in the aggregate savings rate between 2002-03
and 2004-05.
Chart
4 >> Click
to Enlarge
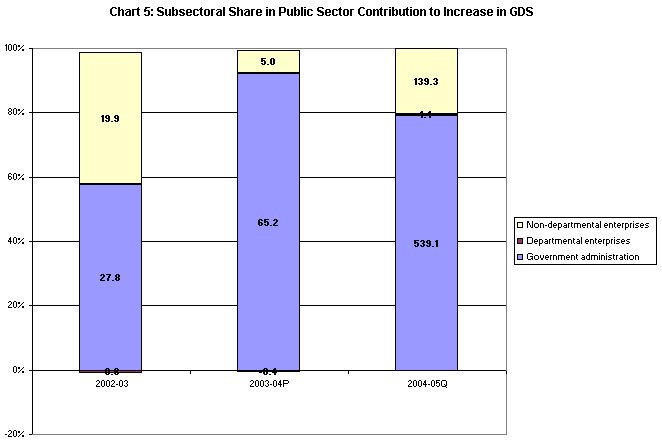
The public sector itself consists of three sub-sectors:
government administration, departmental enterprises
and non-departmental enterprises. An interesting question
to ask is which of these contributed to reduced dissaving
or the increase in saving. There is a common perception
that some of the non-departmental public enterprises,
in the wake of liberalization of public sector pricing
practices, have been able to accumulate large surpluses
that are accumulated in the form of reserves. While
this is indeed true, it does not seem to be the case
that this substantially explains the improvement in
public saving. Rather, as Chart 5 shows, while the
savings of non-departmental enterprises have contributed
to improved savings, especially in 2004-05, it is
the reduced dissaving in government administration
that substantially accounts for the estimated improvement
in the savings rate. This sub-sector accounted for
approximately 60, 90 and 80 per cent respectively
of the contribution of the public sector to increases
in the savings rate in 2002-03, 2003-04 and 2004-05.
Chart
5 >> Click
to Enlarge
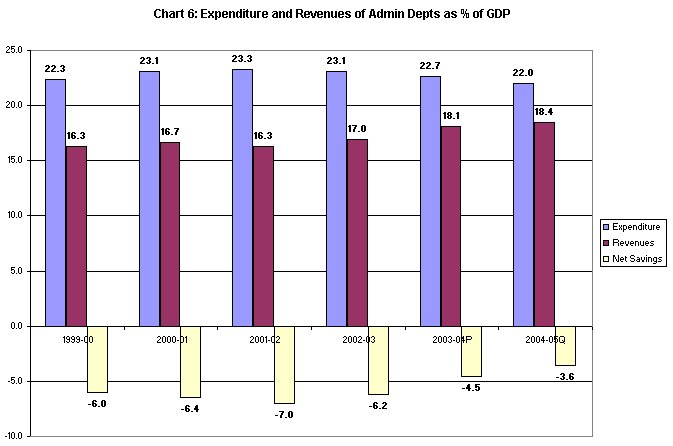
The final question to ask then relates to the factors
that contributed to the improvement in public savings.
As Chart 6 shows both stagnation and decline in government
expenditures and a significant improvement in government
revenues seem to have delivered the reduction in net
dissaving of the administrative departments of government.
Chart
6 >> Click
to Enlarge
This is indeed a puzzle inasmuch as the liberalization
years have seen a sharp reduction in customs tariffs
and that while the deficit at the central level has
come down relative to GDP, no sharp reduction has been
recorded. There could thus be three factors that could
have played a role here. First, a growing curtailment
of public employment, which is by no means positive
given the massive deficit in public services, especially
in rural areas.. Second, improved customs duty collections
despite reduced tariffs, because of an increase in the
quantum of imports and the sharp increases in oil prices.
Third, the contribution of special dividends from to-be-privatised
entities and receipts from disinvestment and privatization
to government ''revenues''.
However, as we noted, the
adjustment in the deficit of government administration
must have in significant measure occurred at the state
level. And states could not have benefited much from
customs tariffs and privatization. In all likelihood
then, the cutback in the size of government administration
must have occurred in large measure at the state level,
which cannot but have adverse implications for development
and the provision of public services.
Needless to say, all this is predicated on the numbers
being reliable. Two features of the savings and investment
estimates released in recent times give cause for concern
on this front. First, the rather sharp revisions made
to the estimates as we move from the quick to the provisional,
revised and final estimates. Second, the huge statistical
discrepancy between savings and investment recorded
in the ''errors and omissions'' category. To the extent
that the capital formation estimate falls short of the
sum total of public, private corporate, household and
foreign savings, the discrepancy is recorded under ''errors
and omissions''. This practice has been controversial
for some time and was to be given up and substituted
with an honest admission of a ''statistical discrepancy''
between savings and investment estimates. But neither
has this been done nor has the discrepancy come down
significantly. In the circumstance we may be debating
an issue which itself is only a statistical mirage.
