Themes > Features
22.02.2000
The Poverty Puzzle
There is now
substantial agreement that India's success at reducing the incidence of
poverty during the 1970s and 1980s was halted, if not reversed, during the
1990s. Estimates made at the World Bank (the most recent update being by
Gaurav Datt in the Economic and Political Weekly Dec 11-17, 1999) show
that the incidence of poverty, which between 1972-73 and 1989-90 fell from
55.4 per cent to 34.3 per cent in rural India and from 54.3 to 34.1 per
cent nationally, has in subsequent NSS rounds up to 1997 (when the
incidence was 34.2 per cent national and 35.8 per cent rural) never gone
below the 1989-90 level and has in fact risen to much higher levels in
individual years (Chart 1).

Other estimates (for example, by S. P. Gupta, Member, Planning Commission, with data up to 1998 and following the Expert Group method) suggest an even greater increase in rural poverty during the 1990s. All these estimates indicate, moreover, that the gap between rural and urban areas, which had decreased during the 1980s and 1970s, increased considerably during the 1990's.
This lack of any further progress on the poverty reduction front is of course a matter of concern, but in the context of official national income figures pointing to rather robust growth during the 1990s, it is also a puzzle. Datt, for example, states that "the 1990s appear to have been a decade of missed opportunities as far as poverty reduction is concerned" but notes also the need for a reconciliation between the pictures thrown up by the National Sample Survey (NSS) and the National Account Statistics (NAS).
Other commentators have gone further and questioned the veracity of the data. Those favouring the liberalisation process tending to dismiss the NSS consumption data. In contrast, those opposed to the economic policies of the 1990s have been sceptical of the large GDP growth figures being brought out in the NAS by the Central Statistical Organisation (CSO).
Matters are complicated because the CSO has shifted midway through the 1990s to a new series of national income with base year 1993-94 (from the old series with base year 1980-81). This makes calculations of growth rates for the 1990s as a whole somewhat difficult. Nonetheless, national income figures from the old series are available for the period 1990-91 to 1996-97 and can be extended to 1997-98 by applying the growth rates reflected in the data relating to the new series.
On that basis we find that the average annual rate of growth of GDP between the triennium ending 1990-91 and the triennium ending 1997-98 stood at 2.41 per cent in the primary sector, 6.81 per cent in the secondary sector, 7.07 per cent in the tertiary sector and 5.65 per cent in the case of overall GDP. The corresponding growth rates for the period extending between trienniums ending 1980-81 and 1990-91 were 3.51, 6.92, 6.05 and 5.36 respectively. Thus, according to this series, the rate of overall GDP growth was in fact slightly higher during the 1990s as compared to the 1980s and, although there is evidence of some slowdown in agriculture consistent with an increased gap between urban and rural incomes, agricultural income growth during the nineties continued to comfortably outpace rural population growth.
The puzzle is compounded because the new series of national income, with 1993-94 as base, has not only upped the GDP estimates but also points to a higher rate of growth than in the old series for both overall and agricultural incomes. Thus, the GDP estimate for 1993-94 is about 9 per cent higher according to the new series than the old, both overall and in agriculture. Also, between 1993-94 and 1997-98, agricultural GDP as per the new series rose by a total of 14.2 per cent as compared with 8.37 per cent according to the old series. Total GDP between these years increased by 31.3 per cent as per the new series as compared with 30.4 per cent in the old series, with GDP in the secondary sector rising by 41.6 per cent in both series and that in the tertiary sector by 37.4 in the new series against 38.6 per cent in the old.
In sum, going by the new series, the agricultural sector has performed much better than suggested by the old series, widening the lack of correspondence between the growth of rural incomes and trends in rural poverty.
A priori, any lack of correspondence between trends in income growth and poverty incidence must be put down to either increased inequality and/or to a failure of per capita consumption to rise along with income, whether because of higher savings or measurement problems. The World Bank estimates of real per capita consumption in rural areas from the various NSS rounds are seen rising sharply between 1972-73 and 1986-87, with a further spurt in 1989-90, but declining subsequently, with the trend level having stagnated at best (Chart 2). This closely tracks the movements (in the opposite direction) of rural poverty.

Also, urban real per capita consumption continued to have a rising trend during the 1990s, consistent with continued fall in urban poverty. From this, and the fact that rural inequality, as measured by the Gini coefficients obtained from the NSS distribution of consumer expenditure, has fluctuated within the range of 27 to 31 per cent throughout, Datt has concluded that poverty increased during the 1990s not so much because of increased inequality but because measured rural consumption from the NSS failed to reflect the income growth in the National Accounts Statistics (NAS).
This is significant because it is known that the NSS tends to underestimate overall consumption in the country, resulting in a substantial divergence between the estimates of total and per capita consumption as yielded by the NSS surveys and in the NAS. If income inequality has not worsened during the 1990s and if the divergence between the consumption estimates provided by the NSS and NAS has increased, then the poverty figures themselves would be suspect.
Till recently, it was the practice in the Planning Commission to calculate poverty figures after blowing up the NSS consumption estimates to deal with such underestimation. A return to such a procedure would not only reduce measured poverty significantly, it could also negate the observed stagnation or rise in the incidence of poverty during the 1990s. The lack of correspondence between growth and poverty trends could then be seen as a result of statistical inadequacies rather than a reflection of real trends.
However, most academic research, as indeed the work at the World Bank, has not in the past favoured blowing up the NSS consumption estimates since there is evidence that most of the underestimation that occurs is in the consumption of the rich, so that the unadjusted NSS figures would still be measuring poverty correctly. Indeed, this was the view of the Expert Group in 1993 as a result of whose recommendation the old Planning Commission method was discontinued.
An implication of this, which is still not adequately appreciated, is that inequality measures obtained from the NSS underestimate the true inequality which is likely to be higher the greater the discrepancy between the NSS and NAS mean consumption estimates. If increasing discrepancy between the two data sets occurs in such a way that NAS shows growth in mean consumption but the NSS shows higher poverty without increased inequality, then either one must reject the Expert Group recommendations outright or conclude that true inequality has risen by so much as to wipe out the possible benefits of growth. Such a situation would, however, be an impasse since in the absence of a measure of "true" inequality, commentators could continue to debate the relative virtues of the erstwhile Planning Commission method versus that of the Expert Group without necessarily reaching consensus.
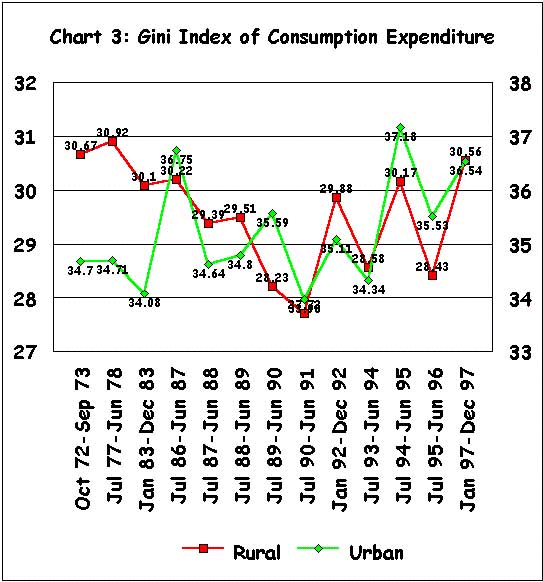
Luckily, however, the evidence, does permit stronger conclusions. First, as Chart 3 shows, the Gini coefficients, or the indices of inequality in the distribution of NSS consumption expenditure, as calculated at the World Bank display interesting trends. Rural inequality fell steadily between 1972-73 and 1990-91, but has since then fluctuated wildly around a rising trend. That is, there is no contradiction between the direction of movements in inequality and that in poverty as far as NSS data for rural India is concerned. In urban India, on the other hand, the 1990s seem to be associated with falling poverty even as inequality increased, presumably because income growth was sufficiently high.
Second, and more importantly, a comparison of the absolute per capita consumption figures at current prices obtained directly from the NSS and from the NAS by interpolating from financial years to NSS rounds (Table 1), shows no strong evidence of a widening gap between the two during the 1990s. The ratio of NSS consumption expenditure figures and NAS consumption expenditure figures as yielded by the series with 1980-81 as base, did fall from 0.79 to 0.69 between 1972-83 and 1990-91, but has remained at that level subsequently (Chart 4).

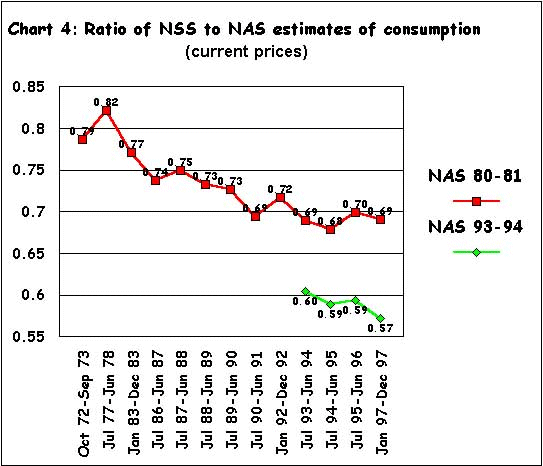
It is true that the same ratio calculated with NAS consumption expenditure figures from the new series with 1993-94 as base does show a decline from 0.60 in 1993-94 to 0.57 in 1997-98, but this is too small to explain the poverty puzzle. Per capita consumption in nominal terms increased by 98 per cent between 1990-91 and 1997 according to the NSS. The corresponding growth in NAS is 99 per cent when the old 1980-81 series is extended from 1996-97 to 1997-98 using the new 1993-94 series and 111 per cent when the new series is carried back to 1990-91 using the old one. The NAS consumption growth would be 140 per cent if the 1997 figure from the series with 1993-94 as base is compared to the 1990-91 figure from the series with 1980-81 as base, but this is surely invalid !
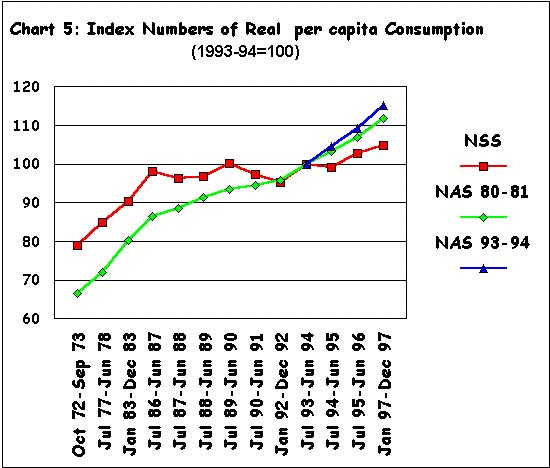
The poverty puzzle is, therefore, not mainly in differences between the NSS and NAS regarding nominal consumption trends but in the trend in real consumption. As Chart 5 shows, the indices of real per capita mean consumption obtained directly from the two national accounts series have increased much more sharply than the index obtained by appropriately averaging the urban and rural real per capita mean consumption figures computed by the World Bank researchers from the NSS figures. The latter shows a growth of only 4 per cent between 1990-91 and 1997 against growth of 20 and 23 per cent according to the old and new NAS series, appropriately spliced forwards and backwards.
That the poverty puzzle is about real and not nominal consumption leads immediately to the conclusion that what is of central importance are the price deflators used to move from nominal to real consumption. As Chart 6 shows, the deflator used by the World Bank researchers has indeed increased much more sharply upwards during the 1990s than those implicit in the NAS estimates. The implicit deflators from the NAS relate to the consumption basket of the nation as a whole, while the deflators for poverty calculations are expected to reflect more closely the consumption basket of the poor. In practice, the deflators used to convert NSS rural and urban nominal expenditures into real trends are based on the official consumer price indices for agricultural labourers (CPIAL) and industrial workers (CPI-IW).
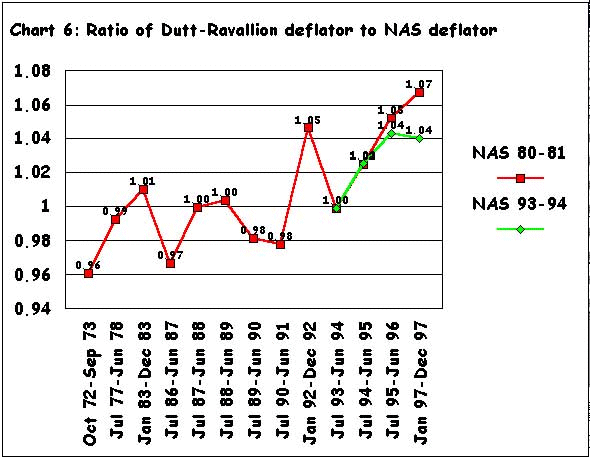
Both these consumer price indices have increased faster than the implicit NAS consumption deflators during the 1990s, and, given the weight of the rural sector, the CPIAL dominates in the implicit deflator for NSS consumer expenditure in the World Bank's real consumption series. Unlike this latter implicit deflator, which is available only by NSS rounds, both the CPIAL and the implicit NAS deflators are available over the entire period 1972-97, and their ratio is plotted in Chart 7. It is evident that the CPIAL increased much less than the NAS deflator in the 70s and 80s but has increased much more in the 1990's.
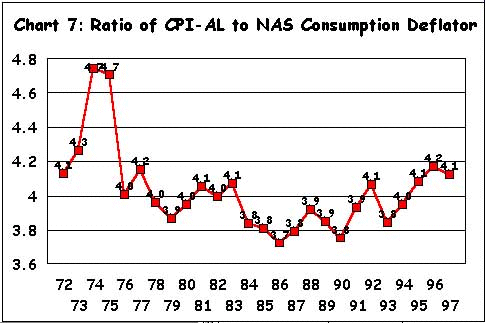
It must be noted that food items have a large weight in the indices of consumer prices for industrial workers and agricultural labourers, especially the latter. The faster rise in these indices are therefore likely to be the result of the observed tendency in recent years of a faster increase in the prices of various food items, particularly cereals, than of other items consumed by the rich.
Thus what emerges is that one of the reasons for the stagnation in real per capita consumption and therefore of the incidence of rural poverty during the 1990s is the adverse consequence that rising food prices have had for the poorer sections of India's population. Clearly, the rise in the relative food price during the 1990s has hurt the poor hard, even at a time of relatively high income growth which itself, as noted earlier, was accompanied by some increase in the inequalities in nominal consumption expenditures.
Trends in Rural Incomes
A noteworthy feature of the trend in the incidence of poverty during the 1990s is the fact that the absence of any reduction in poverty has been more true of rural than urban areas. Does this have anything to do with the changes in the structure and volume of rural incomes? Unfortunately, the CSO does not give a break up of sectoral and total incomes by rural and urban areas respectively, excepting for the two base years 1980-91 and 1993-94. However, the NSS gives figures on employment by sectors for all years. Using this we have computed two series on sectoral incomes with 1980-81 as base for the years 1977-78 to 1996-97 and with 1993-94 as base for the period 1993-94 to 1997-98.
The method adopted for this is as follows. Since we have both sectoral employment and income figures for rural and urban areas for 1980-81 and 1993-94, it is possible to compute sectoral productivities for the primary, secondary and tertiary sectors in the rural areas and urban areas for that year. This allows us to compute the ratio of urban to rural productivities for each sector for that year.
We assume that this ratio remains constant in all subsequent or previous years, i.e. that in the case of each series the rates of growth of productivities are the same so that the ratio of productivities do not change. Based on this assumption, and using the overall GDP figures and the figures on rural and urban sectoral employment from the NSS, the level of rural and urban sectoral incomes is estimated for the remaining years. It should be obvious that assuming that rural productivities in different sectors grow at the same rate as urban productivities would if anything exaggerate the growth of rural income.
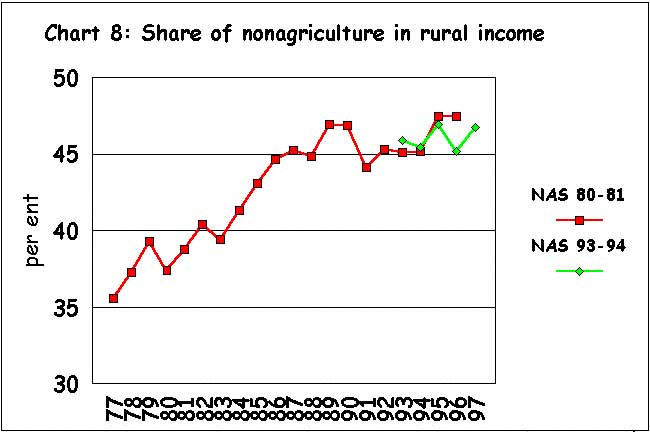
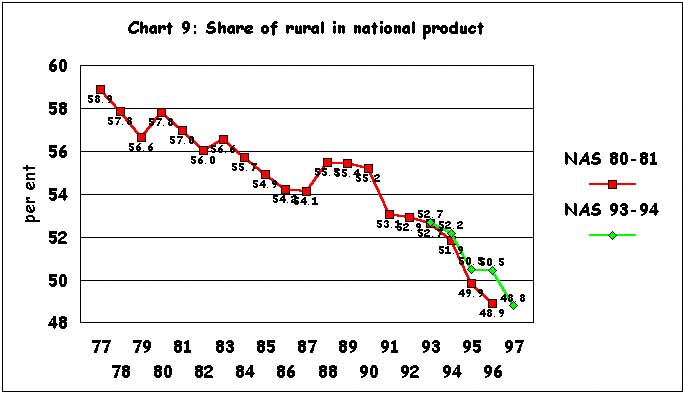
There are two interesting results which emerge from this exercise. First, as Chart 8 shows, the share of rural in total incomes has fallen quite sharply. This is also true for the years for which the figures with 1993-94 as base have been computed. This fall in rural incomes is, however, not just because the share of agricultural incomes in national income have fallen. The second interesting trend is that, the share of non-agricultural incomes in total rural incomes which rose sharply between 1977-78 and 1990-91 has stagnated since then (Chart 9). One reason why rural poverty declined during the 1970s and 1980s was that income earning opportunities in the rural non-agricultural sector, expanded substantially, driven mainly by a large expansion of government expenditure in the rural areas. The reduction in such expenditure during the years of reform has affected that expansion adversely. (Macroscan, February 2000).
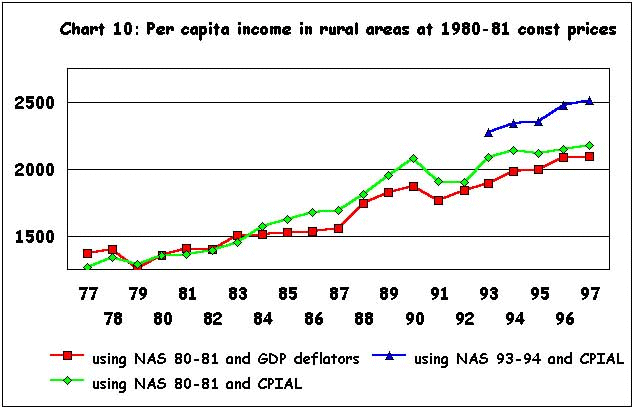
In the event, as Chart 10 shows, the exercise suggests a very sharp slowdown in the growth of per capita rural real output and incomes during the nineties. Such incomes can be measured in two ways: either using the implicit NAS deflators for the composition of rural produced goods and services or by deflating nominal income with the CPIAL as in the poverty calculations. The first method based on the NAS 1980-81 shows a decline in growth rate from 3.1 per cent per annum during the triennium ending (TE) 1980-81 to TE 1990-91 to 1.8 per cent per annum during TE 1990-91 to TE 1997-98. The second method, also based NAS 1980-81 shows an even larger decline, from 3.9 to 1.4 per cent per annum, and indeed shows negligible growth after 1990-91. The pattern is almost identical to that observed for rural real consumption from NSS, as plotted in Chart 2, and thus serves to remove much of the poverty puzzle.
Shifting to NAS with base 1993-94 shows higher incomes and higher growth, but, if this is spliced backward to the old series, the result is still a decline in per capita rural income (CPIAL deflated) from 3.9 to 1.5 per cent. An interesting aspect of the revision of CSO National accounts is that the NAS with 1993-94 as base, places the GDP at factor cost in agriculture at Rs. 223148 crore as opposed to Rs. 206322 crore in the old series with 1980-81 as base. In its elaboration of the factors underlying this Rs. 16826 crore increase, the CSO attributes Rs. 13905 crore to an increase in the value of output of fruits, vegetables and floriculture, as a result of a shift in the data source from Directorate of Economics and Statistics, Ministry of Agriculture to the National Horticulture Board. This has obviously meant that the weight of fruits and vegetables in total GDP has changed quite substantially, and this also contributes significantly to the higher estimate of private consumption in the new series.
The reliance on the National Horticultural Board's figures has also meant that the rate of growth of fruits and vegetables output is now much higher than the figure yielded by other estimates. Thus, while official index of fruits and vegetables production has risen by about 18 per cent between 1993-94 and 1998-99 and the value of fruits and vegetables output rose by about 14 per cent between 1993-94 and 1996-97 as per the NAS with 1980-81 as base, the 1993-94 series shows a 33 per cent increase for the period 1993-94 and 1997-98. As a result fruits and vegetables are now estimated to account for more than 50 per cent of the increase in total value of crop output during this period. It is this factor which contributes to the substantially higher rise in agricultural GDP in the 1993-94 series when compared with the 1980-81 series, which was noted earlier.
It may well be that there has indeed been such massive diversification and increase in the value of fruits and vegetables during the nineties. After all, it is possible that higher urban incomes (which our estimates put, residually, as increasing at over 4.5 per cent in real per capita terms during the 1990s as against only around 2 per cent during the eighties) have boosted demand. But the sheer magnitude of the revision requires re-examination since, if this has indeed happened, fully 23 per cent of crop output is accounted by fruits and vegetables grown in only 4.5 per cent of crop area. If this is not actually the case, then whatever little still remains unexplained in terms of the "puzzle" of higher poverty amidst growth, is likely to lie in the revisions of the national income estimates which have recently been carried out in the NAS.
Thus, a careful look at the available data currently suggests the following : the rate of growth of per capita output in real terms in the rural sector has sharply decelerated from 3.1 per cent in the 1980s to 1.8 per cent in the 1990s .This is a result of the combination of a collapse in rural non-agricultural employment and a significant deceleration in agricultural growth other than in the category "fruits and vegetables". The purchasing power of the incomes derived from sales of this output in turn depends upon the relative price indices, and if the price index relevant for the rural poor (CPIAL) is used, then there is no increase in real incomes in the rural sector. Thus, the trends in rural poverty are no longer a puzzle, but reflect the effects in the countryside of macro-economic policies at work .
© MACROSCAN 2000