Employment under the New Growth Trajectory
Two
developments have been taken as confirmation of the view that India
has transited to a virtuous, high growth trajectory in recent years.
One is the evidence of near sustained 8-9 per cent rate of GDP growth
since 2003-04 and the rather quick and sharp recovery of GDP growth
after the deceleration triggered by the global financial and economic
crisis. The second is the evidence of a significant pick up in employment
growth rates between the 55th and 61st Rounds of the National Sample
Survey Organisation relating to 1999-2000 and 2004-05.
These
developments are seen as evidence that India is now not only placed
on a high-growth trajectory, but that this trajectory is beneficial
from an employment and social development point of view. However, there
are some who still find the need to raise two sets of questions. The
first set relates to the sustainability of this growth given the factors
that are responsible for the traverse to this higher growth trajectory.
The second relates to the interpretation of the evidence on the employment
and distributional outcomes associated with this growth. This article
is concerned with the fall-out of high growth for the level and pattern
of employment.
The quinquennnial large sample rounds of the NSSO provide the most exhaustive
data on employment trends and conditions in India. Unfortunately, the
results of the latest survey on this subject– the 66th Round, covering
2009-10 – are yet to be released, making it difficult to assess the
actual impact on employment of the transition to high growth since 2003-04,
since the previous large sample round relates to 2004-05.
However, the 64th Round of the NSS which had migration as its focus
and includes the annual 'thin' sample coverage of employment and unemployment
does provide us with an additional source of data. Since the 60th Round,
the annual thin sample rounds covering employment have used a separate
schedule (Schedule 10) on employment and unemployment which is canvassed
over a separate set of sample households. Moreover, the overall sample
size for the NSS 64th round is seen as comparable with that of the large
sample NSS 61st round and both were oriented towards households and
persons as opposed to being enterprise based. The real difference is
that the second stage stratum (SSS) in NSS 64th round was designed to
net more migrants and remittance recipient households since migration
was the main focus of this round. On the other hand, the SSS in the
NSS 61st round was tailored to give adequate representation to different
strata of the population to study their employment characteristics.
This difference notwithstanding, it could be argued that we have a reasonably
comparable set of estimates for the years till 2007-08.
The availability of the 2007-08 estimates is of significance because
of the important changes that had occurred with respect to employment
during the first five years of this decade relative to earlier periods.
The first important change from the previous period related to aggregate
employment growth itself. The late 1990s was marked by a dramatic deceleration
of aggregate employment growth, which fell to the lowest rate recorded
since such data began being collected in the 1950s. However, the period
1999-2000 to 2004-05 witnessed a significant recovery, as shown in Chart
1.
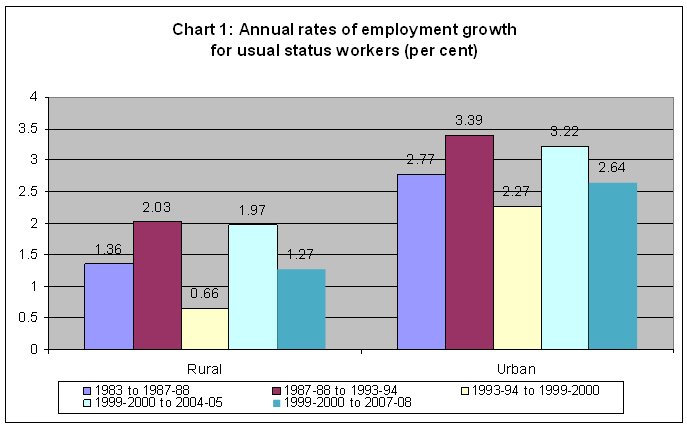
While aggregate employment growth (calculated
at compound annual rates) in both rural and urban India was still slightly
below the rates recorded in the period 1987-88 to 1993-94, it clearly
recovered sharply from the deceleration of the earlier period. The recovery
was most marked in rural areas, where the earlier slowdown had been
sharper.
What is noteworthy, however, is that if we include another relatively
high growth year 2007-08, the rate of growth over 1999-00 to 2007-08
hardly points to much acceleration in employment growth, with the increase
in the growth rates in urban areas being marginal from 2.27 per cent
to 2.64 per cent. What is more striking is that the annual rate of growth
of rural employment, which had risen from 0.66 per cent between 1993-94
and 1999-2000 to 1.97 per cent between 1999-2000 and 2004-05 (which
was a year of indifferent agricultural performance), was at significantly
lower 1.27 per cent over the period 1999-00 to 2007-08 (which was a
good agricultural year). To recall, the period between 2004-05 and 2007-08
was the period when India had moved to the much higher, close-to-9 per
cent GDP growth trajectory. A slower rate of employment expansion in
this period points to a significant fall in the elasticity of employment
with respect to output.
The importance of the years concerned being good or bad agricultural
years comes through from an examination of labour force participation
rates. There was an increase in labour force participation rates for
both men and women in 2004-05 relative to 1999-00 (Table 1). This includes
both those who were actively engaged in work and those who were unemployed
but looking for work. The significant increase in female participation
may have been because of the need (in the lands cultivated by individual
households) for women to substitute for male workers who were looking
for better opportunities outside agriculture in a poor agricultural
year. Or it may be a reflection of the need to augment household earnings
in a bad year.
These possibilities are corroborated by the fact that in the good agricultural
year 2007-08, male participation rates increased marginally, while that
of women fell significantly. This could have been because the compulsions
operating in a bad year were not as operative. This suggests that higher
participation rates as in 2004-05 need not necessarily be a reflection
of improved employment performance. In fact, the increase in aggregate
LFPRs in 2004-05 incorporates declining rates of labour force participation
among the youth, that is the age group 15-29 years, and a rise for the
older age cohorts.
Table 1: Labour force participation rates
| Usual status (PS+SS) | Current daily status | |||||||
| 1993-94 | 1999-2000 | 2004-05 | 2007-08 | 1993-94 | 1999-2000 | 2004-05 | 2007-08 | |
| Rural males | 56.1 | 54 | 55.5 | 55.9 | 53.4 | 51.5 | 53.1 | 53.6 |
| Rural females | 33 | 30.2 | 33.3 | 29.2 | 23.2 | 22 | 23.7 | 20.4 |
| Urban males | 54.3 | 54.2 | 57 | 57.6 | 53.2 | 52.8 | 56.1 | 56.8 |
| Urban females | 16.5 | 14.7 | 17.8 | 14.6 | 13.2 | 12.3 | 15 | 12.5 |
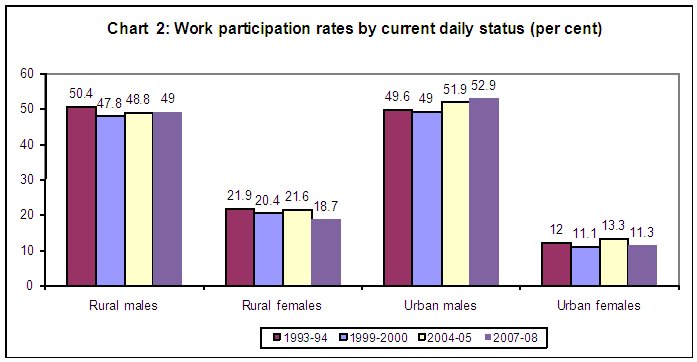
The
changes in work force participation, provided in Chart 2, mirror the
changes in labour force participation for 2004-05, but to a lesser extent.
The biggest change here was for urban males, many more of whom described
themselves as working in some fashion than did so in the two preceding
survey periods. On the other hand in 2007-08, there was no similar significant
increase in male work force participation, as well as a significant
fall in the case of female participation in work in both rural and urban
areas. This partly corroborates the argument advanced above.
One
of the more interesting features that emerge from the data for 2004-05
was the shift in the type of employment. There had been a significant
decline in wage employment in general. While regular employment had
been declining as a share of total usual status employment for some
time (except for urban women workers), wage employment had continued
to grow in share because employment on casual contracts had been on
the increase. But the results of the 2004-05 round point to a fall even
in casual employment as a proportion to total employment, as indicated
in Chart 3.
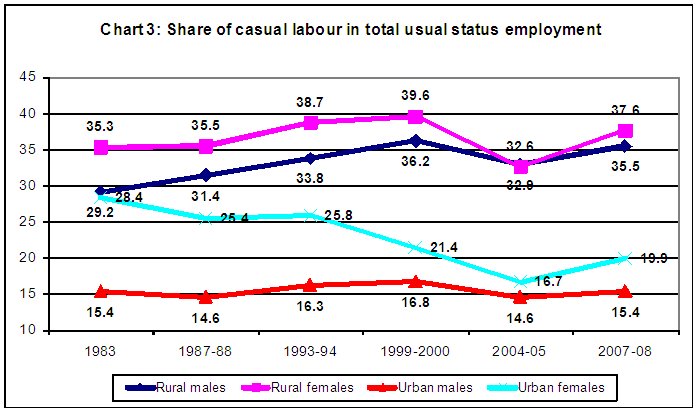
Going by the evidence for 2004-05 it appears that for urban male workers, total wage employment was at the lowest that it had been in at least two decades, driven by declines in both regular and casual paid work. For women, in both rural and urban areas, the share of regular work had increased but that of casual employment had fallen so sharply that the aggregate share of wage employment has fallen. So there clearly appeared to be a real and increasing difficulty among the working population, of finding paid jobs, whether they were in the form of regular or casual contracts. However, by 2007-08 there were clear signs that this decline in the share of casual labour in total was being partially reversed especially in the case of females. Clearly high growth had facilitated an increase in wage employment, though this was still in the casual and not regular category.
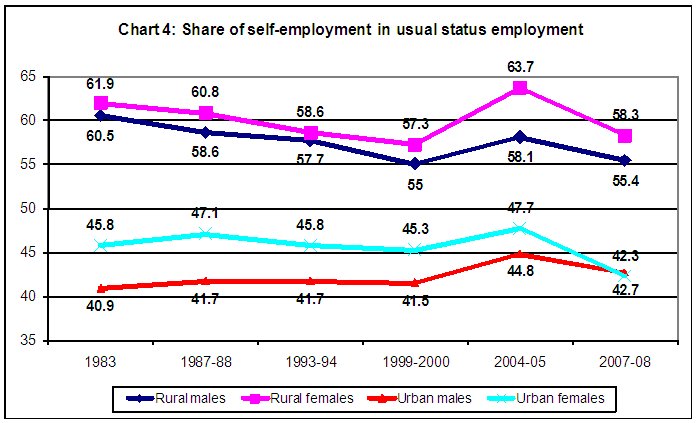
The fallout of these trends was visible in the trends in self-employment (Chart 4). In 2004-05 there was a very significant increase in self-employment among all categories of workers in India. The increase was sharpest among rural women, where self-employment accounted for nearly two-thirds of all jobs. But it was also remarkable for urban workers, both men and women, among whom the self-employed constituted 45 and 48 per cent respectively, of all usual status workers. What seems to have occurred in 2007-08 was that the rise in the share of casual employment had been accompanied by a fall in self-employment, with the fall being sharpest again in the case of females. Even so, all told, around half of the work force in India currently does not work for a direct employer. This is true not only in agriculture, but increasingly in a wide range of non-agricultural activities.
Table 2: Employment by industry
| Per cent of Usual status employment (PS+SS) | ||||||||
| 1993-94 | 1999-2000 | 2004-05 | 2007-08 | |||||
| Agriculture | ||||||||
| Rural males | 74.1 | 71.4 | 66.5 | 66.5 | ||||
| Rural females | 86.2 | 85.4 | 83.3 | 83 | ||||
| Urban males | 9 | 6.6 | 6.1 | 5.8 | ||||
| Urban females | 24.7 | 17.7 | 18.1 | 15.3 | ||||
| Manufacturing | ||||||||
| Rural males | 7 | 7.3 | 7.9 | 7.7 | ||||
| Rural females | 7 | 7.6 | 8.4 | 7.4 | ||||
| Urban males | 23.5 | 22.4 | 23.5 | 23.5 | ||||
| Urban females | 24.1 | 24 | 28.2 | 27.5 | ||||
| Construction | ||||||||
| Rural males | 3.2 | 4.5 | 6.8 | 7.7 | ||||
| Rural females | 0.9 | 1.1 | 1.5 | 2 | ||||
| Urban males | 6.9 | 8.7 | 9.2 | 9.5 | ||||
| Urban females | 4.1 | 4.8 | 3.8 | 4.3 | ||||
| Trade, hotels & restaurants | ||||||||
| Rural males | 5.5 | 6.8 | 8.3 | 7.6 | ||||
| Rural females | 2.1 | 2 | 2.5 | 2.3 | ||||
| Urban males | 21.9 | 29.4 | 28 | 27.8 | ||||
| Urban females | 10 | 16.9 | 12.2 | 12.8 | ||||
| Transport, storage & communications | ||||||||
| Rural males | 2.2 | 3.2 | 3.8 | 4 | ||||
| Rural females | 0.1 | 0.1 | 2 | 2 | ||||
| Urban males | 9.7 | 10.4 | 10.7 | 10.9 | ||||
| Urban females | 1.3 | 1.8 | 1.4 | 1.8 | ||||
| Other services | ||||||||
| Rural males | 7 | 6.1 | 5.9 | 5.7 | ||||
| Rural females | 3.4 | 3.7 | 3.9 | 4.3 | ||||
| Urban males | 26.4 | 21 | 20.8 | 21 | ||||
| Urban females | 35 | 34.2 | 35.9 | 37.8 | ||||
Table
2 provides the details of the industry workers are engaged in. As is
to be expected given the short period of time involved, there have been
no major changes in the structure of employment between 2004-05 and
2007-08, except for a rise in the share of construction among rural
males. Thus the trends in the structure of employment prior to 2004-05
have been more or less sustained. An important feature of this was the
significant decline in agriculture as a share of rural employment, even
as the share of manufacturing employment did not go up commensurately
for rural male workers. The share of manufacturing employment has stagnated
in the urban areas as well. While there has been some shift to construction,
the share of trade, hotels and restaurants seems to be stagnating.
Interestingly, the big shift for urban women workers has been to manufacturing,
the share of which has increased by more than 4 percentage points in
2004-05 and remained more or less there in 2007-08. A substantial part
of this is in the form of self employment.
Thus, overall, the traverse to a high growth trajectory does not seem
to have delivered much on the employment front. The growth rate of employment
remains depressed, even if not as low as during 1993-94 to 1999-2000.
Employment increases seem to occur when workers, especially female workers,
are pushed into the workforce by economic circumstances like a bad agricultural
year. The elasticity of employment with respect to output increases
seems to have deteriorated with accelerated growth. Casual wage labour
and self-employment dominate the employment scenario. And the non-agricultural
sectors appear to contribute inadequately to additions to employment
though these were the sectors that were expected to take up the employment
slack once neo-liberal policies succeed in delivering growth.