|
There
was a short but influential period in recent years when
Indian policy makers sought to persuade themselves and
others that economic liberalisation and greater reliance
on market mechanisms would imply that future economic
growth would result from increased efficiency of investment
rather than rises in the investment to GDP ratio. This
line of reasoning used the argument that high ICORs
(Incremental capital output ratios) which were observed
in India essentially reflected high costs and inefficiency
of resource use, which would be corrected by the liberalising
regime. This in turn, it was argued, would mean that
higher growth would result even from the same rate of
investment, as ICORs would fall across sectors.
The actual pattern of growth over the 1990s has belied
that assumption, especially as growth rates have spluttered
and decelerated in the past few years. There is now
less talk in official policy circles about improved
ICORs (especially since the data indicate anything but
such improvement) and more declaration that the reforms
have succeeded in bringing about an increase in the
aggregate rate of investment in the economy.
But is such an assertion justified ? In what follows,
we examine the aggregate trends in investment over the
past two decades, followed by a more disaggregated look
at particular sectoral investment patterns since 1993-94.
Such an exercise reveals that the ten years of liberalising
reform thus far have not marked any break from previous
trends in terms of increasing investment rates : rather,
if anything, the longer run tendency of savings and
investment rates appears to have slowed down over this
period. Further, in the 1990s certain sectors and forms
of capital formation have actually experienced declines.
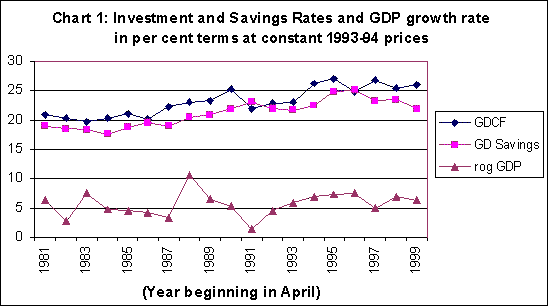
Consider first the patterns in investment, savings and
GDP growth over the past two decades. Chart 1 provides
estimates of gross domestic capital formation and gross
domestic savings as percentages of GDP, along with the
rate of growth of GDP at 1993-94 prices from 1980-81
onwards. The first point to note is that GDP growth
itself does not show any marked increase in the decade
of the 1990s compared to the 1980s, and in fact after
the peak rates of more than 7 per cent achieved during
the middle of the decade have subsequently been lower.
Chart
1 >> Click
to Enlarge
As Chart 1 shows, both savings and investment rates
have increased over time. This increase in both is part
of a trend of much longer duration, whereby savings
and investment rates have tended to increase with economic
development and as the economy expands, in an Engels
curve type pattern whereby increased aggregate incomes
also allow for a larger share for savings. Thus we find
that savings rates have increased from an average of
9 per cent in the early 1950s, to 12 per cent in the
early 1960s, to 15 per cent in the early 1970s, to 18
per cent in the early 1980s.
The increase in the subsequent period can be seen as
part of this broad tendency. However, here it is interesting
to note that while the year-on-year rate of increase
of the investment rate between 1981-82 and 1990-91 was
20.5 per cent, between 1991-92 and 1999-2000 it was
lower at 18.7 per cent. The rate of Gross Domestic Capital
Formation increased from 20.3 per cent to touch a peak
of 26.8 per cent in 1995-96, and has since declined
and stagnated at around 23 per cent. Similarly, while
the rate of savings increased by 16.4 per cent between
1981-82 and 1990-91 and reached a peak level of 25.1
per cent in 1995-96, over the period 1991-92 to 1999-2000
it actually fell marginally.
This is significant because the acceleration in rate
of growth during the latter half of the 1980s occurred
essentially because the investment rate which stood
at around 20 per cent at the beginning of the 1980s
rose to around 25 per cent by the end of that decade.
As compared to this we find that during the 1990s, barring
three years around the middle of the decade of the 1990s,
the investment rate ruled at or well below its end-1980s
level. Clearly, there is a link between the investment
rate and growth, as is to be expected, and the current
slowdown is the result of slack investment demand in
the economy. Not surprisingly, the capital goods sector
is the worst affected in the current recession.
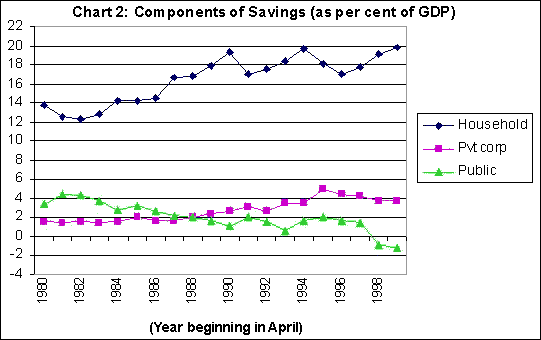
Chart 2 allows a more disaggregated look at the behaviour
of the savings rate. The important compositional change
that is evident here is the gradual decline in public
sector savings as a share of GDP. In fact the public
sector over the 1990s moved from being a contributor
to savings to being a net dissaver. This decline was
not counterbalanced by increased private corporate savings;
rather, it is the increased share of household savings
which has prevented the savings rate from declining
even further. The share of household savings in Gross
Domestic Savings increased from 73 per cent in 1980-81,
to 83 per cent in 1990-91, to as much as 89 per cent
in 1999-2000. Private corporate savings reached a peak
of 4.9 per cent of GDO in 1996-96 and subsequently declined
to 3.7 per cent by the end of the decade.
Chart
2 >> Click
to Enlarge
|
