On
April 4, the US Department of Commerce succumbed to
protectionist pressures and chose to launch investigations
to check whether textile imports from China were disrupting
US markets. US Commerce Secretary, Carlos Gutierrez,
is reported to have said that the decision was the
first step in a process to determine whether the US
market for these products is being disrupted and whether
China is playing a role in that disruption. The immediate
excuse was evidence of a sharp rise in the quantum
of imports of certain varieties of Chinese textiles
into the US market, quota restrictions on which under
the Multi-Fibre Agreement (MFA) were lifted as of
January 1, 2005. As Table 1 indicates, import increases
during the first quarter of the year in select categories
that are controversial have varied from an excess
of 250 per cent to as much as 1600 per cent. However,
there is need for caution when quoting these figures,
because they are growth rates computed on a base kept
low by the MFA's quota regime.
Table
1: Increase in Imports of Specific Categories
of Textiles: Jan-March 2005 |
Category |
Volume
Growth (Percentage)
|
|
|
Cotton
Hosiery |
1084
|
Cotton
Knit Shirts, MB |
1003
|
W/G
Knit Blouse |
1499
|
Cotton
Skirts |
1102
|
Cot.M/B
Trousers |
1492
|
W/G
Slacks, etc. |
1612
|
Cotton
Underwear |
408
|
M-MF
Underwear |
260
|
Table
1 >> Click
to Enlarge
But
touting such figures, US industry associations have
been accusing the Chinese of dumping to an extent
that disrupts the US market and damages the domestic
industry. In the event, they are demanding that the
government should invoke a clause included in China's
WTO accession conditions that permits the US government
to restrict import growth to 7.5 per cent a year till
2008. The Bush government that has recently begun
its second term has been quick to oblige, even though
domestic political pressures are not as overwhelming.
There are, however, a number of reasons to hold that
the US response is either alarmist or orchestrated
to justify a protectionist response. We must recognise
that quotas under the MFA, which limited the quantum
of exports into individual segments of the global
textile market from the most competitive textile exporters,
had two kinds of effects. First, it reduced the competition
faced by US (domestic) suppliers of textiles from
imports from the most cost-competitive centres of
global textile production, allowing the former to
sustain higher levels of output. Second, it reduced
competition between exporters from more and less competitive
locations targeting the same market, by restricting
the volume of exports from more competitive producers.
As a result of these two different forces at play,
the lifting of quotas was expected to have two different
effects. One was an increase in the total quantum
of imports of restricted items into individual markets
because of increased imports from all locations that
are cost-competitive relative to domestic suppliers.
The second was a re-division of an individual market
among exporters, with more cost-competitive suppliers
displacing less cost-competitive ones in individual
segments.
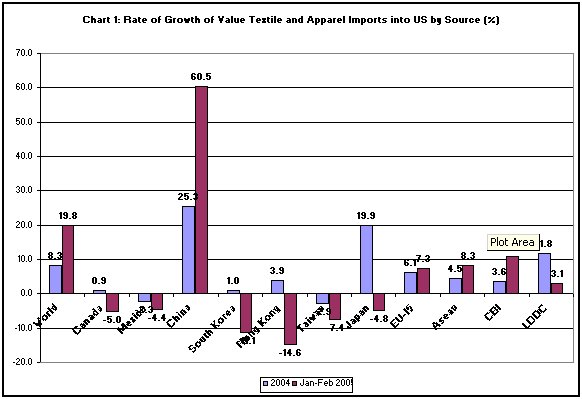
Chart
1 >> Click
to Enlarge
As Chart 1 makes clear, both these tendencies are
visible in the US market. Considering all items of
textile and apparel imports, the US trade balance
report which provides the most comprehensive data,
indicates that total imports into the US market rose
by close to 20 per cent in the first two months of
2005 (relative to the corresponding period of the
previous year) as compared with 8.3 per cent during
2004. Thus the removal of quotas did result in a substantial
increase in imports into the US market that would
have resulted in some displacement of domestic production.
However, the increase in imports from China, which
amounted to 60.5 per cent during January-February
2005 as compared with 25.3 per cent in 2004, was not
wholly directed at the displacement of US production.
Rather, increased imports from China were accompanied
by a decline or slowing down of imports from other
sources such as Mexico, South Korea, Hong Kong, Taiwan
and Japan. That is, after the removal of quotas, Chinese
imports were outcompeting imports into the US from
other sources that were earlier “protected” by the
MFA regime.
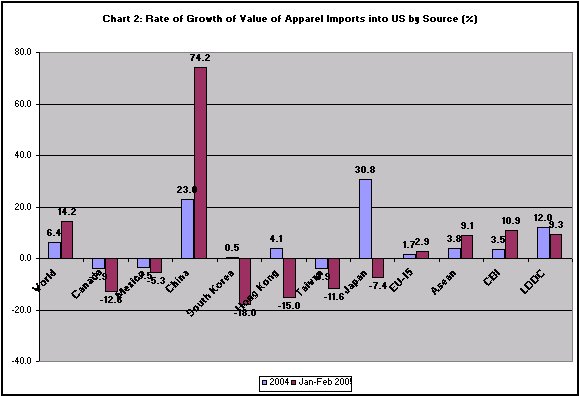
Chart
2 >> Click
to Enlarge
This is not to say, however, that China is wiping
the floor clean. There are other countries such as
the EU-15, the ASEAN countries and countries belonging
to the Caribbean Basin Initiative (CBI) that have
been able to increase the rate of expansion of their
exports. What is disconcerting however is that the
Least Developed Countries (LDCs), which do not receive
the same special benefits as the CBI group in US markets,
have seen a significant decline in the rate of growth
of their exports to the US market. But this may partly
be due to the disruption caused by the tsunami in
at least some of these countries, such as Mauritius.
Some of these features are sharper if we consider
an area like apparel, which is where the bulk of the
increase in imports into the US from China has taken
place. As Chart 2 indicates, while China's apparel
exports to the US grew by close to 75 per cent during
the first two months of 2005, as compared with 23
per cent during 2004, this was accompanied by a substantial
degree of displacement of imports from Canada, Mexico,
South Korea, Hong Kong and Taiwan. Further, besides
increases in imports from country-groupings such as
the EU-15, ASEAN and the CBI, LDCs have registered
a much smaller decline in the rate of growth of imports
than is suggested by aggregate figures.
In sum, not all of China's dramatic export increase
during the first quarter of 2005 was on account of
the displacement of US production. It was partly because
of displacement of export increases from other countries.
And there were countries other than China which contributed
to the growth in overall textile imports into the
US. Above all, as Table 2 makes clear, the effect
of the increase in Chinese exports on exports to the
US from individual developing countries has not been
as adverse as had been expected.
Table
2: US Textile Imports by Country Major Shipper's
Report ($ Mill.) |
|
|
|
|
|
Growth
Rate |
|
2003 |
2004 |
Jan-Feb
2004 |
Jan-Feb
2005 |
Jan-Feb
2004 |
Jan-Feb
2005 |
World |
77434 |
83312 |
12284.1 |
14010
|
7.6 |
14.0 |
China |
11608.8 |
14559.9 |
2002.9 |
3362.4
|
25.4 |
67.9 |
Asean |
11678.2 |
12143.6 |
1867.7 |
2014
|
4.0 |
7.8 |
CAFTA |
9244.6 |
9578.6 |
1266.9 |
1408.4
|
3.6 |
11.2 |
EU-15 |
4336.5 |
4530 |
687.5 |
730.9
|
4.5 |
6.3 |
Sub-Sahara |
1534.9 |
1781.8 |
253.2 |
282.5
|
16.1 |
11.6 |
Bangladesh |
1939.4 |
2065.7 |
324.6 |
359.4
|
6.5 |
10.7 |
Cambodia |
1251.2 |
1441.7 |
234.3 |
259.1
|
15.2 |
10.6 |
Fiji |
79.6 |
85.8 |
13.9 |
7.7
|
7.8 |
-44.6 |
India |
3211.5 |
3633.4 |
588.1 |
737
|
13.1 |
25.3 |
Indonesia |
2375.7 |
2620.2 |
445.4 |
477.6
|
10.3 |
7.2 |
Japan |
522.4 |
641.7 |
78.3 |
79.8
|
22.8 |
1.9 |
South
Korea |
2567 |
2579.7 |
393.9 |
344.3
|
0.5 |
-12.6 |
Laos |
3.9 |
2.1 |
0.3 |
0.1
|
-46.2 |
-66.7 |
Malaysia |
737.5 |
764.3 |
117.3 |
109.8
|
3.6 |
-6.4 |
Maldives |
93.7 |
81 |
12.5 |
4.7
|
-13.6 |
-62.4 |
Mauritius |
269.1 |
226.6 |
43.1 |
37.5
|
-15.8 |
-13.0 |
Mexico |
7940.8 |
7793.3 |
1144.9 |
1097.2
|
-1.9 |
-4.2 |
Mongolia |
181.1 |
229.1 |
25.8 |
21.7
|
26.5 |
-15.9 |
Nepal |
155.3 |
130.6 |
25.9 |
16
|
-15.9 |
-38.2 |
Pakistan |
2215.2 |
2546 |
371.4 |
396.9
|
14.9 |
6.9 |
Philippines |
2040.3 |
1938.1 |
323.6 |
299.9
|
-5.0 |
-7.3 |
Singapore |
270.8 |
244.1 |
34.1 |
34.1
|
-9.9 |
0.0 |
Sri
Lanka |
1493 |
1585.2 |
258.6 |
305.5
|
6.2 |
18.1 |
Taiwan |
2185 |
2103.9 |
308.3 |
283.6
|
-3.7 |
-8.0 |
Thailand |
2071.7 |
2198.2 |
314.1 |
372.8
|
6.1 |
18.7 |
Vietnam |
2484.3 |
2719.7 |
361.8 |
430.2
|
9.5 |
18.9 |
Table
2 >> Click
to Enlarge
What needs to be noted is that the displacement of
US production, to the extent that it occurred, is
a sign that the US has not adequately restructured
its industry during the long years of protection resorted
to for this very purpose. The protection afforded
to developed country textile production with the aim
of restructuring those industries began in the 1961,
when the Long Term Agreement on textiles was signed.
That agreement provided the developed countries with
a 10-year respite, during which they were expected
to either phase out a part of their uncompetitive
textile production, “burdened” by high wages, or modernise
their textile industries to render them competitive.
The promise to do away with protection in ten years
did not materialise. Protection was continued under
the Multi-Fibre Agreement, which was once more scrutinised
for phase-out under the Uruguay Round Agreement of
1994. But even under that agreement, the phase-out
of quotas was back-loaded, with quotas on close to
half of global textile trade kept in place till January
1, 2005. It is well known that most developed countries
first lifted quotas on items of less relevance to
developing country trade, reserving true liberalisation
till the beginning of 2005.
What the first-quarter surge in textile exports to
the US indicates is that despite 45 years of protection
expressly justified by the need to restructure the
industry, the US has not done so, unlike countries
such as the UK whose dependence on textiles during
the early stages of their industrialisation was even
greater. But the US is not the only culprit. Even
countries in the EU (such as France and Italy) are
using the US resistance to the Chinese export surge
as the basis for a demand for greater protection for
their own textile production. The European Union's
trade commissioner, Peter Mandelson, has been resisting
pressure to impose restrictions on Chinese textile
imports, on the grounds that the available evidence
of market disruption is inconclusive and could not
justify curbs for the time being. However, his ambivalent
postures, resulting from differences within the Community,
suggest that the EU too might resort to import curbs.
Responding to calls from countries like Sweden not
to impose such curbs, since that would amount to protectionism,
Mandelson declared: We should not confuse protection
with protectionism.
All this controversy arises despite efforts by China
to dampen the growth of its textile exports since
January 2005 to temper the reaction to likely export
increases. In December 2004, China imposed export
tariffs of Rmb0.2-Rmb0.3 per item in some cases and
Rmb0.5 per kilogramme in others in response to concerns
in the US and Europe that Chinese textile exports
might surge following the expiry of quotas on January
1. Now, China is contemplating further export tariffs.
Expectations are that China might raise export tariffs
by as much as Rmb2-Rmb4 per piece. Such action is
being contemplated despite the danger that Chinese
exporters are likely to be badly hit, because prices
for garment orders are fixed several months before
shipment.
China's need to bend over backwards to placate the
US results from three factors. First, China's own
dependence on the US market for exports that have
become a major engine for its growth. Second, the
huge trade and current account deficit on the US balance
of payments, which is resulting in a depreciation
of the dollar and rising the spectre of a financial
crash and global recession. Third, the huge US trade
deficit with China that the former wants to reduce
by getting China to revalue its currency. The message
is clear, if developing countries record a deficit
on their balance of payments it is their problem and
a reflection of their mismanagement. If the US records
a deficit on it external account that is everybody's
problem and a reflection of a global “imbalance” that
needs correction.
Unfortunately, imposing curbs on Chinese textile imports
into the US or the EU may not resolve the problem
either of unemployment in the US and EU textile industries
or the deficit on the US trade account. It would merely
serve to increase textile exports from other developing
countries to the US and EU. But the fact that this
could be used to divide developing country exporters
and win the support from some of them in the battle
against China may suit the US and EU. It helps win
allies in the battle to force China to turn inwards
rather than grow on the basis of burgeoning exports.
Globalisation is good only when the US-and perhaps
the EU-reaps its benefita. If that does not happen,
protectionism or voluntary export restraint is the
preferred alternative.
