Growth
in India is slowing, even as inflation remains stubbornly
high. According to recently released figures, GDP
growth during the first quarter of 2008-9 stood at
7.9 per cent, down from the 9.2 per cent rate of growth
registered in the corresponding quarter of the previous
financial year. India, some fear, may have crossed
a turning point, with growth in the future likely
to be below the creditable 9 per cent per annum trajectory
achieved over the last five years. But, it could be
argued that a single quarter is no indication of what
could happen over even this financial year, let alone
over a longer period. In fact, over the last five
years there has been one (2004-05) when the rate of
growth fell to 7.5 per cent, only to bounce back the
next year. So the prospect of a long-term trend rate
of growth of 9 per cent may not have eroded as yet.
However, there are a number of features of growth
performance during the first quarter that give cause
for such concern. To start with, among the sectors
that have lost their momentum is agriculture. This
is of significance because advocates of reform have
been arguing that over the last three to four years,
the long-term, post-reform tendency for agricultural
growth to lag behind industry and services has been
reversed. If that was true, it is indeed an important
development, because one factor that was taking the
sheen off the higher growth of the 1990s and after
was the extreme disproportionality in growth between
the agricultural and non-agricultural sectors. The
disparity in the rate of growth of agricultural and
non-agricultural GDP increased significantly after
the 1970s, with the process being particularly marked
after the mid-1990s.
Chart
1 >> Click
to Enlarge
However, figures on trends in crop production do not
unequivocally support such a view. To start with,
in the case of all important crops, rates of growth
in individual years have been extremely volatile,
with high growth occurring in particular commodities
in very different years. The rate of growth of rice
stood at -6.1 per cent in 2004-05, 10.5 per cent in
2005-06, 1.7 per cent in 2006-07 and 3.21 per cent
in 2007-08. The corresponding figures for wheat were
-5.0, 1.1, 9.2 and 3.4. Volatility was particularly
marked in coarse cereals (-10.9, 1.8, -0.6 and 20.1)
and oilseeds (-3.2, 14.8, -13.2 and 18.5). The only
consistent and good performer was cotton with rates
of growth of 19.7, 12.8, 22.2 and 14.2 per cent in
each of these four years.
As a result of this volatility, a second feature of
recent agricultural growth performance was that the
average increase in production over the period 2003-04
to 2007-08 was low for almost all important crops
excepting sugarcane and cotton. Finally, the revival
in agricultural production holds largely for a few
non-foodgrain crops, especially cotton and sugarcane,
and not in foodgrains, which is one area where the
recent inflation in prices occurred. Thus, the “agricultural
revival”, as reflected in the figures on growth in
agricultural production was at best partial, and did
not correct the fundamental weakness that has characterised
post-reform growth in India.
The evidence that supported the view that the differential
between agricultural and non-agricultural growth rates
was being redressed was the rate of growth of GDP
in Agriculture and Allied Activities. While the rate
of growth of GDP in this sector was just 2.9 per cent
over the period 2000-01 to 2007-08 as a whole, it
stood at 5.9, 3.8 and 4.5 per cent respectively over
the three years ending 2007-08. Hence, the new evidence
that on a first quarter to first quarter basis agricultural
growth has fallen from 4.4 to 3.0 per cent, is indeed
disconcerting, especially because of news that the
monsoon this year has not been all too munificent
in many parts of the country.
The second feature of the first quarter 2008-09 GDP
figures that gives cause for concern is the fact that
manufacturing growth has slowed substantially from
10.9 per cent in the first quarter of 2007-08 to just
5.6 per cent during April to June of this financial
year. An aspect of the high growth in recent years
was that unlike during the second half of the 1990s
and the early 1990s, the sector that contributed significantly
to the growth transition was manufacturing, which
had recorded a sharp acceleration in annual rates
of growth after 2003. It had also registered a significant
and consistent increase in its contribution to the
quarter-on-quarter annual increment in GDP. This less-recognized
aspect of the growth story signified a shift away
from the excessive dependence on services to generate
increases in India’s GDP growth. What we have now
are signs of a possible reversal of this tendency.
Third, there is reason to believe that the Construction
sector, which had experienced significant acceleration
in its contribution to GDP from 7.7 to 11.4 per cent
of GDP between the first quarters of 2007-08 and 2008-09,
is losing its dynamism in recent times. Not only do
reports indicate that property prices and activity
in the property market are subdued, but credit to
the housing sector is drying up. Personal loans to
the housing sector, which grew by 25 per cent in 2007-08,
registered a much lower increase of 10.7 per cent
last year. And the increase in lending to the real
estate sector fell from 69 per cent to 38 per cent.
Finally, the evidence suggests that growth has once
again come to depend on an expansion of services,
with Services GDP growing faster than aggregate GDP.
But here too growth has been decelerating in most
areas. A disaggregated analysis suggests that there
is only one component of the services sector—Community
Social and Personal Services—that appears to have
registered an acceleration in GDP growth.. On the
other hand, the rate of growth of the other important
segments of services— Financing, Insurance, Real Estate
and Business Services and Trade, Hotels, Transport
and Communications—which were important players in
the aggregate growth story of recent years and incorporate
most of the so-called “modern services”, have shown
signs of deceleration.
Put all this together and the picture is by no means
comforting. Especially since this slowdown, with signs
indicating that it could persist, occurs in the context
of sharp inflation exceeding 12 per cent on an annualised
basis. Food articles are important contributors to
this high inflation rate. Since agricultural growth
appears to be slowing as well, this buoyancy in prices
is likely to continue. The observed ability of the
system to manage the effects of the difference between
agricultural and non-agricultural growth is clearly
now weakening, presaging a long episode of slow growth
and inflation, or stagflation.
It is in this background that we need to assess the
likely consequences of the implementation of the Pay
Commission’s recommendations, including the payment
of 40 per cent of the arrears that would give government
servants a windfall gain. Inasmuch as that gain would
result in increased expenditure and demand it would
have the salutary effect of spurring growth. But inasmuch
as the increased demand occurs in a context where
prices are already rising and agricultural supplies
are constrained it is bound to spur inflation as well.
It is, therefore, likely that a government faced with
a series of state elections that culminate in a national
election next year, would look to the foreign exchange
reserves the country has to resort to imports to hold
the price line. That may not be good for the long
run viability of domestic production, especially in
the agricultural sector. But what matters in practice
is what is good for the UPA, not what is good for
the country.
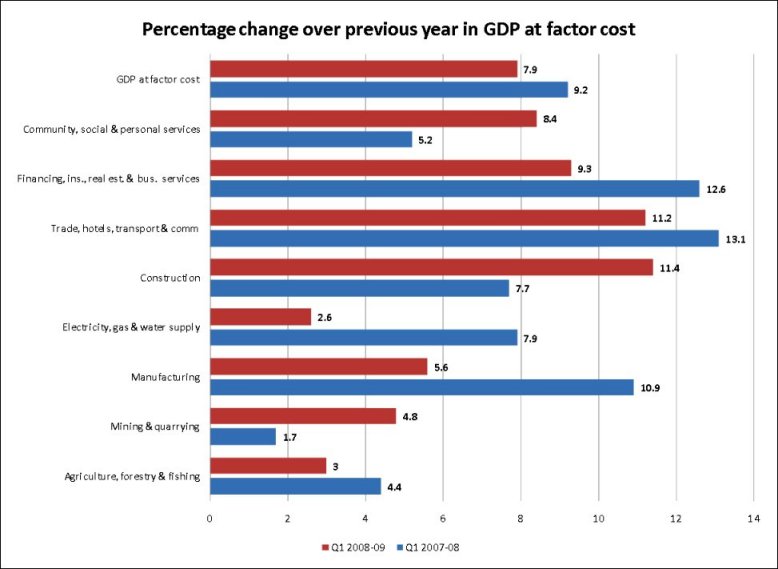
Percentage change over previous
year
in GDP at factor cost |
00
|
00
|
|
|
Q1 2007-08 |
Q1 2008-09 |
|
Agriculture, forestry & fishing |
4.4 |
3.0 |
|
Mining & quarrying |
1.7 |
4.8 |
|
Manufacturing |
10.9 |
5.6 |
|
Electricity, gas & water supply |
7.9 |
2.6 |
|
Construction |
7.7 |
11.4 |
|
Trade, hotels, transport &
comm |
13.1 |
11.2 |
|
Financing, ins., real est. &
bus. services |
12.6 |
9.3 |
|
Community, social & personal
services |
5.2 |
8.4 |
|
GDP at factor cost |
9.2 |
7.9 |
|
Source:
Central Statistical Organisation |
Table
1 >> Click
to Enlarge
