The
leaders of organised manufacturing in India complain
much. About intrusive government, inadequate economic
reform, overly high taxation, inflexible labour markets
and much else. Even if there is an element of truth
in any or all of these, this does not seem to have
affected the sector's ability to garner higher profits
in the years after liberalisation. The sector seems
to have done extremely well for itself since the early
1990s.
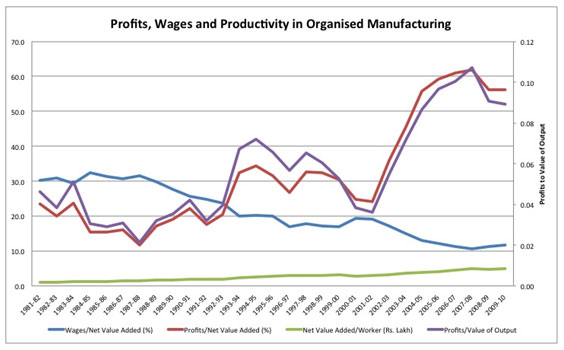
Consider trends emerging from the official Annual
Survey of Industries relating to the organised manufacturing
sector depicted in the accompanying chart.
Chart
1 >> (Click
to Enlarge)
To start with, since the early 1990s, when liberalisation
opened the doors to investment and permitted much
freer import of technology and equipment from abroad,
productivity in organised manufacturing has been almost
continuously rising. Net value added (or the excess
of output values over input costs and depreciation)
per employed worker measured in constant 2004-05 prices
(represented by the green line), rose from a little
over Rs. 1 lakh to more than Rs. 5 lakh. That is,
productivity as measured by net product per worker
adjusted for inflation registered a close to five-fold
increase over this 30-year period. And more than three-fourths
of that increase came after the early 1990s.
Unfortunately for labour, and fortunately for capital,
the benefit of that productivity increase did not
accrue to workers. The average real wage paid per
worker employed in the organised sector, calculated
by adjusting for inflation as measured by the Consumer
Price Index for Industrial Workers [CPI(IW) with 1982
as base], rose from Rs. 8467 a year in 1981-82 to
Rs. 10777 in 1989-90 and then fluctuated around that
level till 2009-10. The net result of this stagnancy
in real wages after liberalisation is that the share
of the wage bill in net value added or net product
(the blue line), which stood at more than 30 per cent
through the 1980s, declined subsequently and fell
to 11.6 per cent or close to a third of its 1980s
level by 2009-10.
A corollary of the decline in the share of wages in
net value added was of course a rise in the share
of profits (red line). However, the trend in the share
of profits is far less regular than that of the other
components in net value added. Between 1981-82 and
1992-93, the ratio of profits to net value added fluctuated
between 11.6 per cent and 23.4 per cent. During much
of the next decade (1992-93 to 2002-03) it remained
at a significantly higher level, fluctuating between
20.4 per cent and 34.3 per cent, but showed clear
signs of falling during the recession years 1998-99
to 2001-02.
However, the years after 2001-02 saw the ratio of
profit to net value added soar, from just 24.2 per
cent to a peak of 61.8 per cent in 2007-08. These
were indeed the roaring 2000s! Unfortunately for manufacturing
capital, the good days seem to be at an end. There
are signs of the profit boom tapering off and even
declining between 2006-07 and 2009-10. But this latter
period being short, we need to wait for more recent
ASI figures to arrive at any firm conclusions.
As of now, what needs explaining is the remarkable
boom in profits at the expense of all other components
of net value added. An interesting feature that emerges
from the chart is the fact that the ratio of profits
to value of output (violet line), or the margin on
sales, tracks closely the irregular trend in the share
of profits in value added described above. Increases
in profit shares have clearly been the result of a
rise in the mark up represented by the profit margin
to sales ratio, or the ability of capital to extract
more profit from every unit of output.
Interestingly, the periods in which the ratio of profits
to the value of output has risen, leading to sharp
increases in profit shares, were also the years when
the two post-liberalisation booms in manufacturing
occurred. The first of those was the mini-boom of
the mid-1990s, starting in 1993-94 and going on to
1997-98, which was fuelled by the pent-up demand in
the upper income groups for a range of goods that
had remained unsatisfied prior to the liberalisation
of imports and foreign investment rules. The second
was the stronger and more prolonged boom after 2002-03,
led by new sources of demand, which was arrested by
the global financial crisis in 2008-09. The coincidence
of the profit and the output booms suggests that,
in periods of rising demand, the organised manufacturing
sector in India has been able to exploit liberalisation
in two ways. First, it has been able to expand and
modernise using imported technologies, raising labour
productivity significantly in the process. Secondly,
it has been able to ensure that the benefit of that
productivity increase accrues almost solely to profit
earners, because of the conditions created by the
''reformed'' economic environment.
As a result, the mark up rose significantly or sharply
in these periods and delivered a profit boom. The
evidence is clear. Big industrial capital has been
a major beneficiary of reform. Its complaints are
not to be taken too seriously.
*
This article was originally published in the Hindu,
10 May 2012, and is available at
http://www.thehindu.com/opinion/columns/Chand
rasekhar/article3403450.ece
