And,
of course, matters are much worse considering only
those crops whose data is firm. Although current estimates
of foodgrain production for 2003-04 are a whopping
19% higher than in 2002-03, this is only 4% higher
than in 1998-99; and the overall Index of Agricultural
Production (IAP) has increased less than 3% between
1998-99 and 2003-04. The IAP per capita of rural population
is thus actually down 6% from 1998-99 while per capita
foodgrains output is down 5%.
Moreover, this is not all. The feature that distinguishes
the last five years, and worries farmers most, is
that farm prices have drifted relatively lower despite
low output growth. With agricultural GDP at current
prices shown 27.3% higher in 2003-04 than in 1998-99
against 10.4% increase at constant prices, agricultural
prices increased 15.4%. But during the same period,
non-agricultural GDP is estimated to have increased
39.2% in constant prices and 69.1% in current prices,
implying 21.5% increase in non-agricultural prices.
The GDP estimates imply at least 5% terms of trade
loss for agriculture over 1998-2004.
Again, matters might be worse since official terms
of trade indices from the Ministry of Agriculture
had already shown 5% decline during 1998-2002, when
terms of trade from GDP estimates had shown only 2%
decline. But in any case, taking terms of trade into
account, the purchasing power of agricultural incomes
has actually declined in per capita terms during 1998-2004
even by the optimistic NAS figures; and this decline
is by more than 10% if one combines official Indices
of Agricultural Production and Terms of Trade. Thus,
despite some diversification, overall agricultural
outcomes have been poor, both on output and prices.
As far as output is concerned, this is because rates
of growth of yields per acre have declined very sharply
for almost all major crops. Considering all the crops
covered in the IAP, yield growth had averaged 2.5%
per annum during the 1980s, dropped to around 1.5%
by 1998-99, and has averaged only about 0.5% during
the last five years. Underlying this are some long-term
trends, e.g. the plateau reached by ‘green revolution'
technology and inadequate public investment since
the 1980s. But matters have worsened recently on these
and other fronts, such as extension and cooperative
credit, because the Fifth Pay Commission bankrupted
state governments.
Of course, some states have done better than others
on output growth and the private sector has begun
extension activities for some crops in some regions.
But, with very few winners and many losers, agricultural
production performance is not an aspect in which India
is shining. However, the political fallout is not
entirely clear since, with most states opposition
ruled, the blame-game will be about Centre-state responsibility
and response. And the debate is likely to be on whose
incumbency hurt more, not what is to be done in the
future.
On the price situation, however, the NDA is much more
vulnerable. After all, it was the Centre that caved
in at WTO and dismantled quotas prematurely, exposing
Indian agriculture to the international price volatility
that many farmers blame for their woes. And, although
attractive support prices were announced, farmers
in most regions did not actually get any price support.
Moreover, contrary to recommendations of some committees
to extend support operations, there are plans to halt
support purchases altogether and link support prices
to insurance – a misguided alternative already being
piloted in some districts where Rabi arrivals will
coincide with elections.
Turning to rural poverty, can this have reduced given
the poor agricultural outcomes? Also, given the near
vacuum on policy initiatives on agricultural production
and price instability, what are the ideas to deal
with this? The important aspect that needs noting
in this context is that rural incomes are not all
from agriculture and that fall in crop prices, although
this hurts farmers, can improve conditions for those
who buy food.
Chart
>> Click
to Enlarge
The ‘shining' campaign has put particular emphasis
on the achievement on roads and thus of rural connectivity.
And available NSS data does show fairly massive rebound
(by over 40%) in rural non-agricultural employment,
particularly construction, transport and trade, during
1997 to 2001-02, after a collapse during 1990-91 to
1997. Moreover, available data on wages and prices
show that the consumer price index for rural labour
increased less than other price indices after 1998-99
and that real wage rates have increased. Further,
rural non-food consumption is increasing whether one
goes by NSS or independent data. Thus, there are clear
signs of rural dynamism if one goes beyond agriculture.
However, paralleling the poor agricultural performance,
there is also evidence of stagnation in agricultural
employment while the number of rural workers dependent
on wage employment has increased very sharply (over
45% since 1991). NSS data in fact show a doubling
of current unemployment among usual rural workers
over the period 1997 to 2001-02. Furthermore, although
the ‘shining' campaign has correctly identified the
fairly large antyodaya grain supplies as a major achievement
of the NDA, overall per capita cereals consumption
(whether measured by availability or from NSS consumption
estimates) has declined.
This coexistence of some dynamism in rural non-agriculture
alongside declining agriculture makes it difficult
to identify exactly what is happening to overall rural
well-being. This is compounded because the only reliable
source of information on this, the NSS consumption
expenditure surveys, have become non-comparable. Pressure
from ‘reformers', stung by NSS results that showed
increased rural poverty from 1990-91 to 1998, caused
a change in the nature of the questions asked in these
surveys.
Some experimental surveys had shown that asking 365
day, rather than 30 day, questions on items such as
clothing and durable goods throws up improved distribution
and that asking 7 day questions on food returns 30%
higher food consumption than 30 day questions. So,
instead of the uniform 30 day recall used previously,
the 1999-00 NSS questionnaire was changed to only
365 day for clothing and so on and both 7 and 30 day
questions for food. Not surprisingly, this led to
much lower measured rural poverty, by almost 50 million.
Since then much has been written on comparability
of subsequent NSS data, and it is sufficient to note
that it is now agreed that rural poverty did not decrease
by anything like 50 million and that, although the
proportion of poor is likely to have declined somewhat,
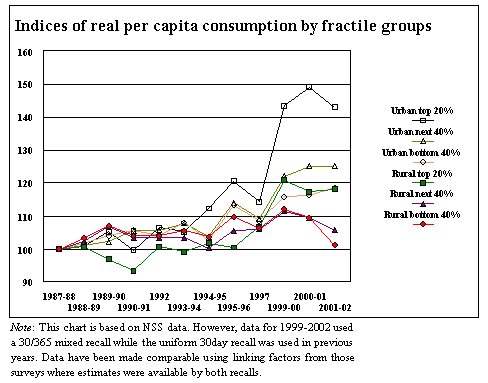
the number of poor may actually have gone up. More
importantly, it is now agreed that, properly interpreted,
NSS data from 1993-94 onward show very large increase
in inequalities (see chart) – across states, between
rural and urban, and within urban areas. Moreover,
although evidence on inequalities within rural areas
is less clear, the trend towards lesser inequality
that had begun in the mid-1970s with rural development
programmes and extended public distribution has clearly
halted.
But, consistent with the divergent indications on
agriculture and rural non-agriculture discussed above,
the most interesting indication from NSS data from
1993-94 to 2001-02 is that although cultivators and
agricultural labourers have done badly, and the self-employed
in non-agriculture have also not done well, those
employed for wages or salary in non-agriculture have
done much better. In fact, salaried employment, proximity
to urban growth, and the ability to migrate emerge
as main determinants, not only of the ability to avoid
poverty but also as sources of relative affluence.
Although cultivators still dominate among the richest
20% in rural areas, the proportion among the rural
rich of affluent non-cultivators with urban connections
has increased rapidly.
This should interest those attempting to guess political
outcomes. Although caste and religion continue to
dominate networks of patronage, the combination of
poor agricultural outcomes and rapid urban growth
in recent years has shifted the rural balance from
traditional elites towards those who can offer urban
access. It is here that the BJP, traditionally much
weaker in rural than urban areas, can be the biggest
gainer. Rural India is definitely not ‘shining'. But
access to the shine that exists, which the ‘shining'
campaign has made even more apparent, is now through
networks where that party is stronger. The moot question
is whether this shift in balance merely affects how
people tell outsiders how they will vote or whether
this is so deep that it will actually show up in how
they finally vote?
On this, NDA strategists might like to mull over the
following about rural India. It remains overwhelmingly
agricultural, is about to go into elections in a year
after severe drought, and is being bombarded with
celebrations of ‘shining' without any solution being
offered for what is definitely a longer-run crisis.
There have in the past been only four years before
the current one when national income has grown more
than 8%: 1967-68, 1975-76, 1988-89 and 1996-97. These
have all followed a year of drought and all except
1975-76, when Indira Gandhi declared an Emergency,
were election years. The ruling party suffered losses
every time.
